03. Iterative Deletion and the Median-voter Theorem
ECON 159.?Game Theory

Lecture 03. Iterative Deletion and the Median-voter Theorem

https://oyc.yale.edu/economics/econ-159/lecture-3


Last time we talked about the idea of deleting dominated strategies: looking at a game; figuring out which strategies are dominated; deleting them; looking at the game again; looking at which strategies are now dominated; deleting those; and so on and so forth. This process is called the "iterative deletion of dominated strategies."
Iterative Deletion of Dominated Strategies?embodies the idea of putting yourself in someone else's shoes and trying to figure out what they're going to do, and then think about them putting themselves in your shoes, figuring out what you're going to do, and so on and so forth. Last time, we saw already, that this is a very powerful idea, in that game last time. But we also saw it's a dangerous idea to take too literally: that sometimes this can get you to over-think the problem and actually, as in that numbers game last time, the best choice, the winning choice, might not involve so many rounds.?
One tip about this, try to identify all the dominated strategies of all players before you delete, then delete. Then look again. Try to identify all the dominated strategies of all players again, and then delete. That process will prevent you from getting into trouble. So today, I want to be a little bit less abstract?to look at a famous application from politics.?
So we're going to look at a model of politics. The idea is going to be this. We're going to imagine that there are two candidates, and what these candidates are doing is they're choosing their political positions for an election.?
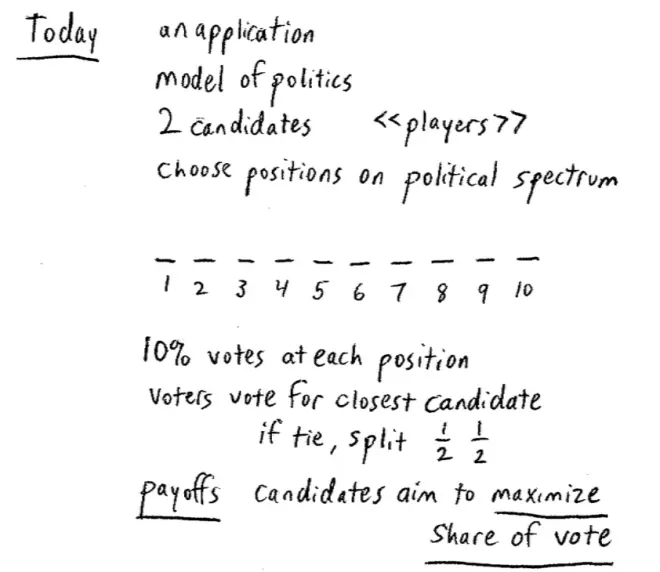
So these are the players, and the strategies are going to be - they're going to choose positions on a spectrum, on a political spectrum. To make life easy, we're going to assume that this political spectrum has ten positions. So here are the positions. We'll call them 1, 2, 3, 4, 5, 6, 7, 8, 9, and 10. Very difficult. What's the idea here? We haven't finished describing the game. What's the idea? The idea is that these positions are left wing positions and these positions are right wing positions. ?
We're going to assume that voters will eventually vote for the closest candidate. So voters vote for the closest candidate: the candidate whose position is closest to their own. And we'll need a tiebreaking assumption and we'll do the obvious tiebreak. If there's a tie then the voters split. We'll assume that they're trying to maximize their share of the vote.?
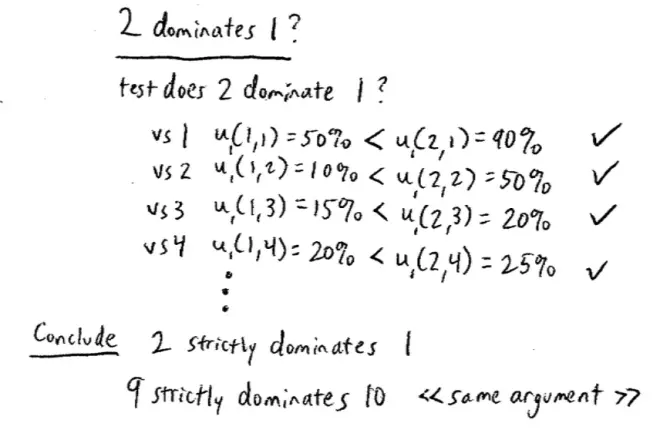
Are any of the strategies here?dominated? Our conjecture here is that 2 dominates 1. That's the claim. Let's just be careful here, what does it mean to say that 2 dominates 1? It means that choosing position 2 always gives me a higher share of the vote than choosing position 1, no matter where the other candidate positions herself. It does not mean 2 beats 1.?
Then we're going to compare my payoff from choosing 1 against the other candidate's payoff from choosing 1. We're going to compare this with my payoff from choosing 2 against the other candidate choosing 1.?What's my share of the vote if I choose 1 and the other candidate chooses 1? 50%. What's my share of the vote if I choose 2 and the other candidate chooses 1? 90%. He will get or she will get all the voters at 1. I'll get everyone else. So I get 90%. So in this case choosing 2 is better than choosing 1. But of course we're not done yet. We have to consider other possible positions of my opponent.?
So suppose my opponent chooses 2. So now we're comparing my choosing 1, when my opponent chooses 2, and the payoff I would get if I choose 2 when my opponent chooses 2. So what's my payoff if I choose 1 and my opponent chooses 2? I get all the voters right on top of me at position 1 and she gets everyone else, is that right? So I get 10%. And what about if we both choose 2? 50%, everybody happy with that? So 50% in this case, and once again, 2 did better than 1.?
Therefore?2 is always better than 1, and?ignoring these first two positions which were a bit weird, choosing 2 always gave me 5% more votes than choosing 1, regardless of what the other person chooses.?
It?is symmetric, so?10 is going to be dominated by 9 in exactly the same way.?Choosing 9 always is better than choosing 10 regardless of what the other person chooses.?
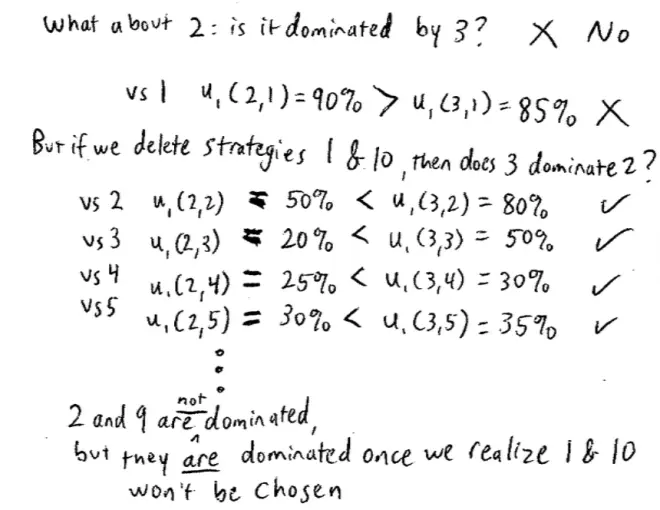
Even though it's the case that 2 is not a dominated strategy, if we do the process of iterative deletion of dominated strategies and we delete the dominated strategies, then maybe we should look again and see if it's dominated now. So let's be careful here, we're not saying that we're going to delete the voters at 1, or delete the voters at 10 (though we might wish to). What we're saying is, we know that the candidates aren't going to position themselves at 1 and aren't going to position themselves at 10. So in some sense we're deleting those strategies. The voters are still there.?
If we delete the strategies 1 and 10, which were dominated, then does 3 dominate 2? Once again, we can try it out. So let's try it out. So the payoff from choosing 1, let's start against 2. So the payoff from choosing 2 against 2 is 50%. The payoff from choosing 3 against 2 is what? What's the payoff from choosing 3? Someone can shout out. What's the payoff from choosing 3 against 2? 80%: the person at 2 is going to get all the ones at 1, and all the ones at 2; and 3 will get everything else. So this is 80% versus 3. The payoff of 2 against 3 is all the people at 1, all the people at 2, so it's 20%. The payoff from choosing 3 against 3, is of course 50%, so, so far so good.?
And again, you can see exactly the same pattern is going to emerge here. From here on down, if I bothered to do it, we'd find that choosing 3 always gets me 5% more of the vote than I would have had from choosing 2, against any of these higher numbers.?Then we realize that probably choosing 2 (and of course 9) isn't a good idea either. So 2 and 9 are not dominated but they are dominated once we realize 1 and 10 won't be played, or won't be chosen.?
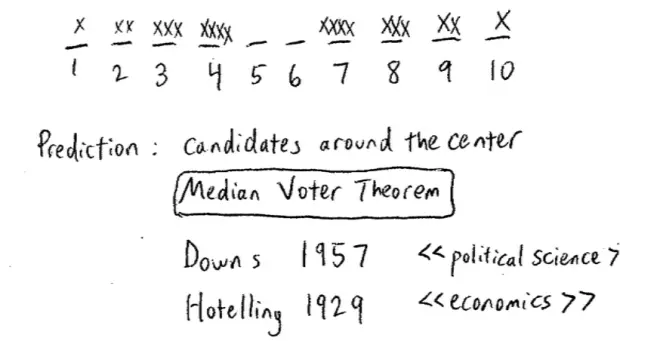
So if we do the procedure of iteratively deleting dominated strategies, going back again, looking what's dominated, doing it again, doing it again … all that's left is 5 and 6. So this procedure leads us to conclude that the candidates will choose positions 5 and 6. Does 5 dominate 6, or 6 dominate 5, or anything like that? So in the end, the procedure, so iterative deletion leads to deleting all except 5 and 6.?
The prediction here is that the candidates are going to be squeezed towards the middle. They're going to choose positions very close to each other and very close to the center. This is the "Median Voter Theorem".?It's called the Median Voter Theorem because the voters at the center, in this case 5 and 6, actually get to decide not just the election, but to decide therefore, what policies are put in place.?
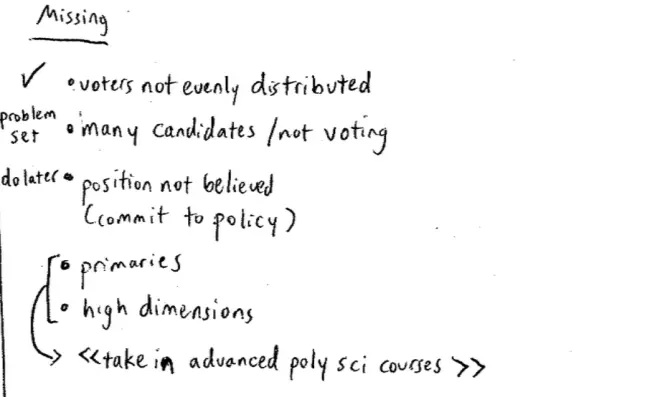
One thing that seems odd about the way we set up this model is that the voters are not evenly distributed. There's an issue of turnout;?and?We have many candidates, more than just two; and we have choosing your position, the inability to commit to a position. We?also?had primaries; and we had other dimensions, so we had higher dimensions.?
These models abstract from very important parts of reality, and the next step to try to enrich the model, to add more into the model, and see if you get a different result, and if so why? And that'll help you explain why you're getting different results in different settings. So the sort of religious part of today's class is models are always abstractions. You want to use them to see what's missing, and then add things back in, to see if they make a difference, and if so how.?
So it turns out that the very first one, voters are not evenly distributed is certainly true, it's undoubtedly true. But it turns out that if you make the voters distributed more realistically, let's say like on a bell-curve shape, it makes actually no difference to the result at all. So this is true, but it doesn't actually change the result. So on this one we're okay. The result survives this change.?
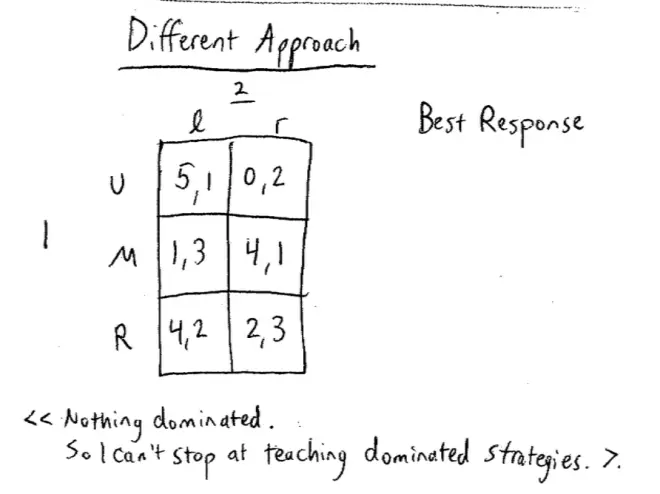
So here's a game, a very simple game with two players. It is the best response model.?Player I is choosing Up, Middle, or Down. And Player II is choosing Left or Right, and the payoffs are as follows. They're nothing very interesting. They're just numbers thought up for the purpose: (4, 2) and (2, 3). So we've got (5, 1), (0, 2), (1, 3), (4, 1), (4, 2), and (2, 3).?
I claim that neither player has a dominated strategy.?So if the only tool I taught you in this class was dominated strategies and the iterative deletion of dominated strategies we'd be stuck. You wouldn't be able to get started on this game.
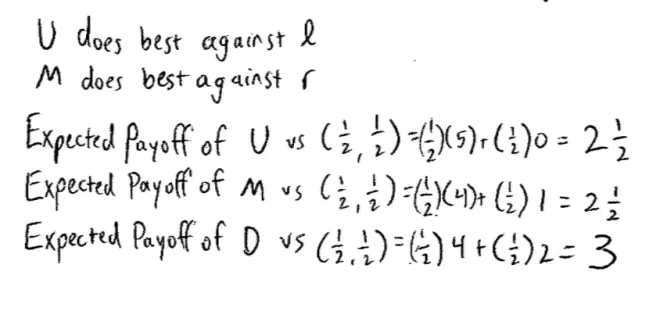
I?might not be sure?whether my opponent, is choosing Left or Right. For example, I might believe that it's equally likely that they choose Left and Right, is that right? So let's look at something. Let's look at my payoffs from choosing these three options Up, Middle, and Down, if I think it's equally likely that my opponent will choose Left and Right. So what we're going to look at is the expected payoff of Up versus, let me call it a (?, ?): a (?, ?) being equally likely that my opponent chooses Left and Right.?
If I thought it was equally likely that my opponent was going to choose Left or Right, then actually my best choice, my best response is to choose Down. Not only is it a good compromise., Not only is it safe. It's actually the best I can do. It maximizes my expected payoff. Now we're not quite there yet. We know that Up does best against Left. We know that Middle does best against Right. And we know that Down does best if I think it was equally likely that the person was going to choose Left and Right. But that's not the only beliefs I could have.?
For example, I could believe that it's twice as likely that the person's going to choose Left as Right. It could be, they're twice as likely to choose Left as Right. So equally likely was probabilities of ? and ?. What probabilities are associated with thinking it's twice as likely they're going to choose Left than Right? What probabilities are associated with that: (2/3, 1/3). If I thought there was 2/3 probability they'd choose Left and 1/3 probability they'd choose Right, then I think it's twice as likely they're going to choose Left, and I could redo this calculation. And in principle, I could redo this calculation for every single possible probability you could think of. Let's draw a picture.?
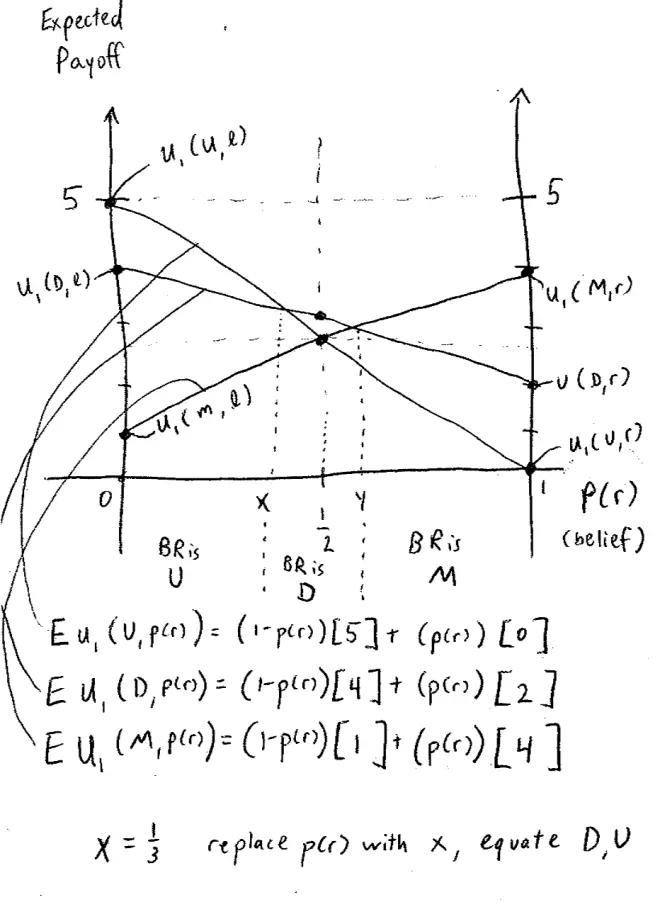
What I want to do is I want to draw a picture here, in which on the horizontal axis, I'm going to put the probability of the other guy choosing Right. It's my belief that the other guy's going to choose Right. Think of this as a belief. On the vertical axis--I'll put two vertical axes in, just for the sake of things--on the vertical axis I'll put my expected payoffs. And let's start by considering my payoffs on this picture, just to help myself a bit, let me put some points in here.?
Let's start by plotting my expected payoff from choosing the strategy Up. We know that if I choose Up and there's probability 0 that the other guy is going to choose Right, that's the same as saying I choose Up and the other guy chooses, let's try it again. If this probability is 0 that the other guy chooses Right, that's the same as saying that the other guy is going to choose Left. So the probability is 0 of the other guy choosing Left is, the same as, let's try it again. Probability is 0 of their choosing Right is the same as saying they choose Left, so that my payoff from Up against that is given by the top box up there, I get 5. So this is my payoff from choosing Up against Left.
Conversely, if there was probability 1 that the other guy is going to choose Right, and I choose Up, then I get 0. So this point here corresponds to my payoff if I choose Up and they choose Right. And we already know if I look at the probability of a ?, which is here, that the payoff I get from choosing, the expected payoff I get from choosing up against a (?, ?) is 2.5. So here's a third point we can use.?
This is my expected payoff from choosing Up against the probability of the other person choosing Right, and what is it actually equal to, just to confirm the equation, it's: (1 minus the probability that they choose Right), in that case I'll get a payoff of 5 plus (probability that they choose Right), in which case I get a payoff of 0.?
Once again, we can plot that point So if the other person's choosing Right with probability 0, that's the same as saying they're going to choose Left, and if I chose Middle against Left, I get 1?and if I knew they were choosing Right for sure, that's the probability of 1 that they're choosing Right, and if I choose Middle I get 4, that's here. And we've already agreed that if I think it's equally likely they're going to choose right and left, that there's a probability ? of them choosing right I get 2.5 from choosing Middle.?
This is the payoff to Player I of choosing Middle against Left. This is the payoff to Player I of choosing Middle against Right, and the line in between?is the expected payoff to Player I of choosing Middle as a function of the probability that other people choose Right. Now again, we could write down the equation. it's going to be: (1 minus the probability they'll choose Right) times 1, plus (the probability that they choose Right) times 4.?
So let's put in now, the third of these lines. I really should have used a different color already. Let me switch colors. Let's put the line that corresponds to choosing Down. So that third line, not to belabor the point, is going to go through here, through 4 and through 2, so this is the payoff from choosing Down against Left, and this is the payoff from choosing Down against Right, and I got those from looking at these payoffs here and here. In between, once again, it's a straight line. So here's the straight line, and this line is the expected payoff to Player I from choosing Down as it depends on the probability that the other person chooses Right, and then once again, we can write down the equation. It's (1 minus PR) times 4, plus PR times 2.?
Let's put in these crossing points here, for example--what I can say is, if I think it's very likely –let's call this point X--if I think that the probability that the other person's going to choose Right, is less than X, then the highest payoff I can get corresponds to this line. That's the highest line and that line corresponds to me choosing Up. If I think the probability that they're going to choose Right is less than X, then my best response is to choose Up.?
Conversely, if I think it's more likely than this crossing point Y--I think it's very likely they're going to choose Right. It's more likely than Y--the probability that they're going to choose Right is more than Y, then the highest line of these three is this one, which corresponds to my choosing Middle. So over here, my best response is to choose Middle. Let's put that in. So over here my best response is Middle and over here my best response is Up, and in between it's going to turn out that the highest lines, if my belief that the person's going to choose right is more than X and less than Y, then my highest expected payoff comes from that blue line, and in that case my best response is Down.?
What we can actually do is we could solve out for the X and for the Y. So what we're going to do is take the equations for those two lines, so here's one of those equations and here's the other one, set the P in those equations equal to X.?