29. Global Warming III (Exam III review)
GG 140: The Atmosphere, the Ocean, and Environmental Change

Lecture 29.?Global Warming III

https://oyc.yale.edu/geology-and-geophysics/gg-140/lecture-29

Review of Exam 3 [00:00:00]
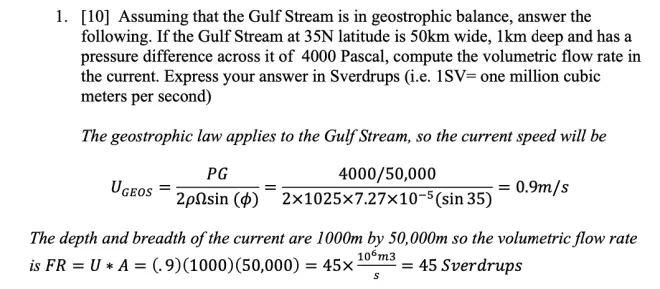
The way I did it was first to use the formula for geostrophic speed, which is the pressure difference divided by the length over which the pressure changes. That's the so called pressure gradient. And then down below goes 2, the density of water, times the rotation rate of the earth, times the sine of the latitude.
What goes into this is a ΔP of 4000 Pascals, a length of 50 kilometers, 50,000 meters, 2, the density of seawater is about a 1025. The rotation rate of the earth is 7.27x10⁻⁵. And the sine of the latitude, it's going to be the sine of 35 degrees. When you put in all those numbers, I got 0.9 meters per second for the speed of flow in the Gulf Stream.
To get the volumetric flow rate, that's going to be the rate of the product of the area and the flow speed. The area is given by the product of the depth and the width. So it's going to be 50,000 meters times 1000 meters. So that's going to be 5 times 10 to, what the seventh? So when you put this value into there and this value into there, I got about 47x106?cubic meters per second. That's the volume, how many cubic meters of water per second are passing through some line you draw across the Gulf Stream. I asked you to express that--I asked you to express that in sverdrups. A sverdrup is 1,000,000 cubic meters per second. So this is 47 sverdrups.?
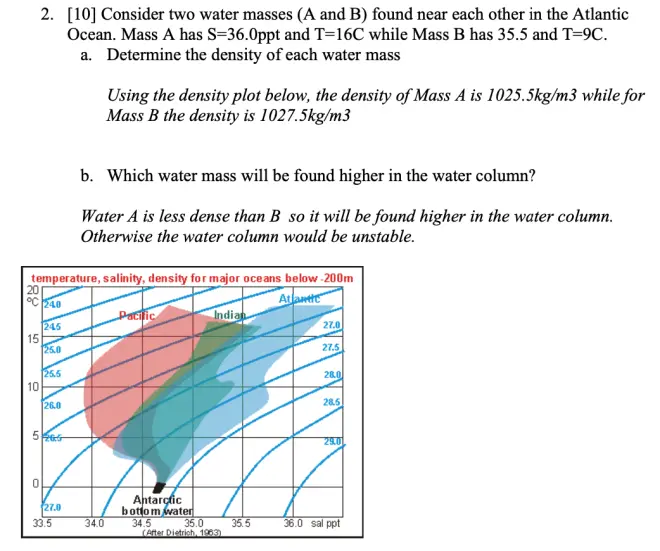
Now I mentioned in class that quite a number of you have forgotten that you need to put a 10 in front of the numbers that are given here. For example these things are written something like 27.5. You need to make that into 1027.5 in order to have proper units of kilograms per cubic meter. To remember that, you could look back at the properties of water on the front page, where I give a typical density for seawater as 1025 kilograms per cubic meter. A number like 27.5 would be ridiculous for water.?
The other thing is then A turns out to be less than B. And therefore because density must increase going down, water mass A must be the higher one in the water column. And that was the second part to that question.
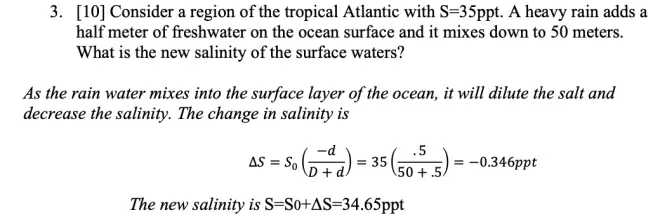
Change in salinity is given by the initial salinity minus d over capital D plus little d. And the problem said the heavy rain adds a half meter. So d is plus 0.5 meters. And that fresh water is mixed down to a depth of 50 meters. So the effect of that added fresh water is felt all the way down to 50 meters. That means I put in 35 parts per thousand for S0?and then it's minus 0.5 over 50 plus 0.5 and that comes out to be minus 0.346 parts per thousand. And because the original salinity 35, the new salinity is then 34.65 parts per thousand. I just subtracted that from the 35 to get the new salinity.?
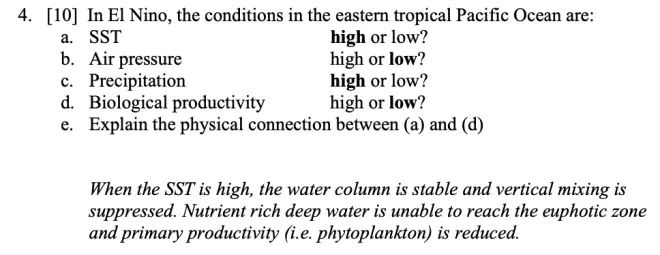
Question four was about El Ni?o and in the eastern tropical Pacific, so in the east there, the SST would be higher than usual, the air pressure would be lower than usual, precipitation higher than usual, biological productivity lower than usual. And explaining the relationship between A and D, that would be like this. So if you have warm water near the surface and cold water beneath, it's going to be very difficult for nutrient rich waters to reach the surface because of that stability in the water column. If the nutrients can't reach the euphotic zone, then you're going to have low biological productivity.
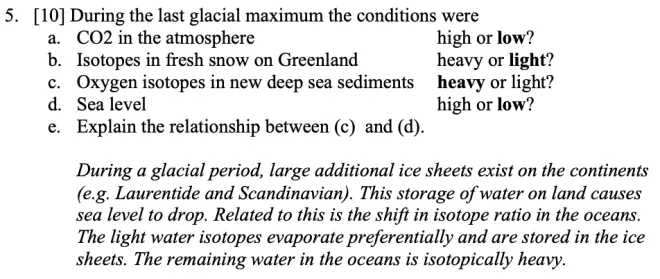
Question five was about the last glacial maximum. CO2?in the atmosphere was low, the isotopes in fresh snow on Greenland would be lighter than normal, because in that cold condition there would be more precipitation between source and Greenland. More water would have been rained out, the heavier isotopes rain out, you end up with lighter ones on Greenland. The isotopes in deep sea sediments would be heavy because with ice stored on land, it would be isotopically light. The remaining water in the ocean would be isotopically heavier and the sediments would have picked up and retained that signal.
Sea level would be low because water is stored on land. So then the relationship between C and D, oxygen isotopes in deep sea sediments in sea level, well I've just said that, so sea level low means that water is being stored on land in the ice sheets. And because that is light isotopes, because of the evaporation process, that's going to make the oceans heavy.?
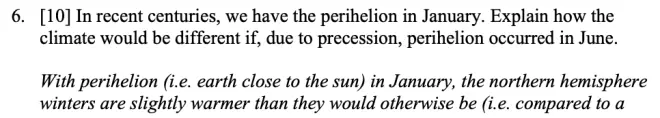
The sun will be off center and?earth will be here and here. And this will be today. But this will be say 10,000 years from now. And today the perihelion is in January, which means the tilt of the earth is like that. If it was going to be in June, then we know that the tilt of the earth would be like this, because this is northern hemisphere summer, which is June. So the tilt is like that.
So then what I wanted you to explain was basically how these two climates would be different. And one thing is that in this season the northern--in this situation, the northern hemisphere summers, being perihelion, would be warmer. The northern hemisphere winters would be colder because of that distance. So the northern hemisphere seasons would be stronger.
The southern hemisphere seasons would be weaker, because in the winter tilted away, you’re closer to the sun, tilted towards, you’re further from the sun. So the proper answer would be that the intensity of the seasons would be changed, but oppositely early in the northern and southern hemispheres.?
Greenhouse Gas Emissions Scenarios [00:20:45]
So we're going to finish up the global warming discussion today by talking about emission scenarios. Now again, the primary reference here is the IPCC reports. So everything in the diagrams I'm showing are almost entirely from the IPCC reports which you have, or you can get very easily. But there's another report as part of it, SRES. It also is on the IPCC website which stands for--What does it stand for? Special Report on Emission Scenarios.?
So the idea is here that some economists and some industrial engineers got together to imagine how the emissions of carbon dioxide in the atmosphere might proceed over the next 100 years, based on certain population and economic assumptions. And then for each of those, they handed those off to the climate modelers. And the climate modelers ran their climate models with these different carbon dioxide concentrations. And the result is a set of projections into the future of how both CO2 and Earth's climate will change.?
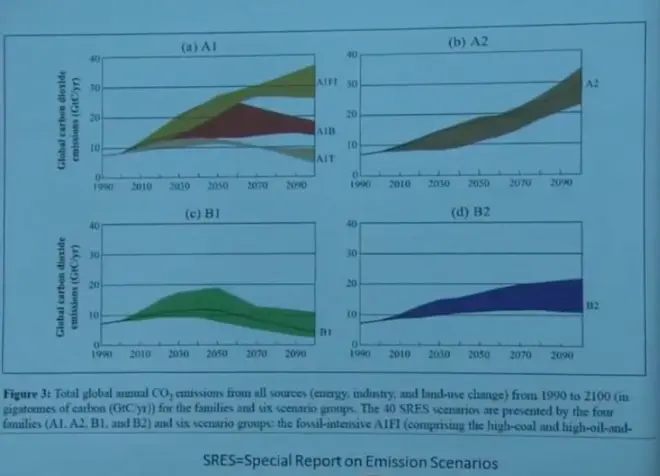
So here are most of the IPCC emission scenarios. Time is on the x-axis from 1990 to 2100. Emission rate is on the y-axis in units of gigatons of carbon per year. Gigatons of carbon per year. Remember that's not the mass of CO2, that's the mass of the carbon in the CO2. So if you want to compute the math of carbon dioxide, just correct for the ratio of the molecular weight of a carbon dioxide molecule to the carbon by itself. 44/12 would be that ratio, right? Carbon dioxide is 44, carbon 12. So yes. Just multiply these times 44/12.
And the A1 is broken up into some subcategories. Generally the As have quite a bit of increasing emissions over the next 100 years. The two B scenarios are a little more optimistic. they climb and then declined for B1, or climb and then increase at a very much slower rate for B2.
These documents were published using data from about 2000 and projecting it from about 2002 and we have a few years now to look and see which of these lines we've been on the last five years. It's a little bit hard to tell, because they don't diverge so strongly in the first few years. They're all pretty similar. But from the articles I've read recently, it looks like we're a bit closer to the higher projections than we are to the lower ones, if you look what's happened over the last five years.
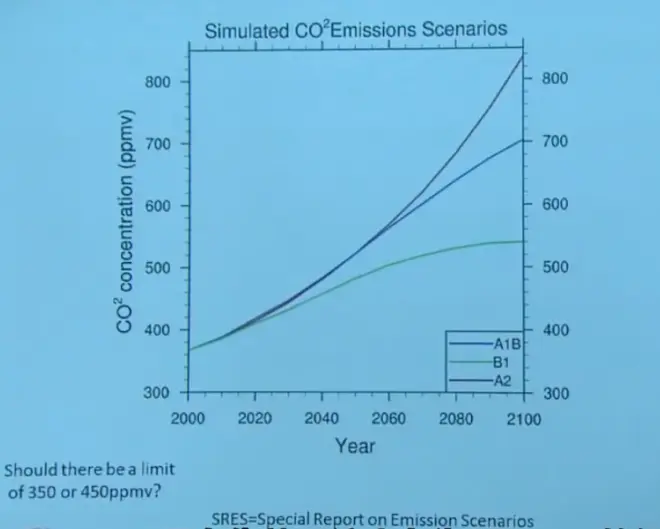
From that, with a bit of understanding of how some of that carbon dioxide will be recycled back into the biosphere, you can come up with carbon dioxide concentration projections over the next 100 years. You see that the B1 scenarios are leveling off, whereas the A scenarios are climbing very rapidly, especially the A2 scenario, which has us reaching over 800 parts per million by volume by the year 2100.
Now are you familiar with this organization called 350.org? So this is McKibben's organization. With some scientific basis, I'm not sure everyone would agree, but with some scientific thought, they've decided that 350 should be the limit we should strive for on CO2. But remember, we've already passed that. We're at 397 already. So but just for record, you could put that on this diagram, 350.org would have you put the limit right there. It helps you to understand how far in exceedance of that number we are and will be in the future.?
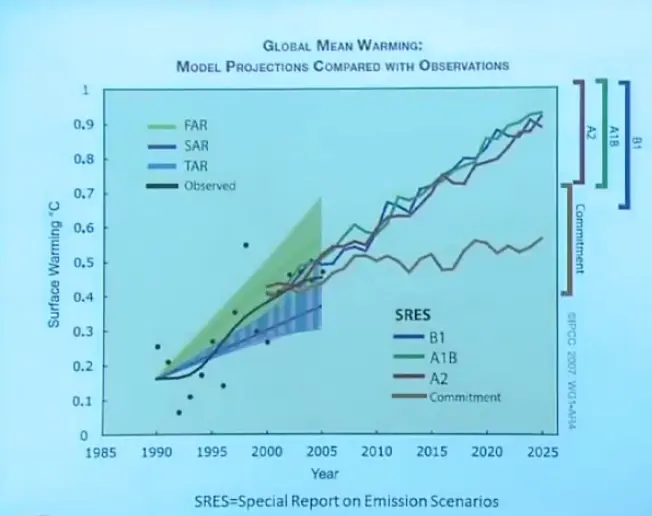
Again, this is from IPCC report. It shows the surface warming based on a pre-industrial reference and versus time, 1985. This just only goes to 2025. This is a short time scale here. It shows something called the commitment curve. That is code for constant composition. In other words, that essentially says no further CO2?emissions starting in the year 2000, essentially.
Now the temperature does continue to climb on that, because even with constant CO2?emissions, you still have to warm up the oceans. Remember the oceans are putting a lag on all of this, because of their enormous heat capacity. So this continued rise is due to mostly trying to warm up the oceans, even though the greenhouse effect is kind of fixed.?
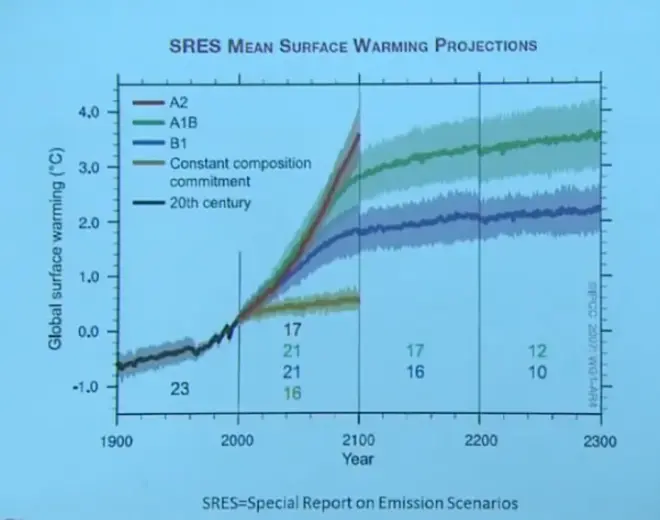
Now when you go out to a much longer time scale, that's when you see the big differences. So here is up to the present day, this is actual data, and here's the constant composition commitment curve that you saw beginning to peel off in the previous one. While the other ones continued together, but by the time you get to 2050 now, they're beginning to diverge quite strongly. And by 2100 they really are quite different. But I think if the last five years is any guide, probably you'll be up in this upper range if things continue as they are going. So that's a warming of about--again this is based on this reference, not pre-industrial--but that's a warming of about 3 degrees Celsius from the current day.
Then they begin to level out. All of these scenarios begin to level out, except for A2 perhaps, because of the assumptions that have been made. And in fact by the time we are removing fossil fuels at a high rate for the next 100 years, we will have depleted a fairly significant fraction of the fossil fuel. So this turning over is not all our choice. Some of this will turn over simply because the remaining amount of fossil fuels to be burned is getting to be so small.?
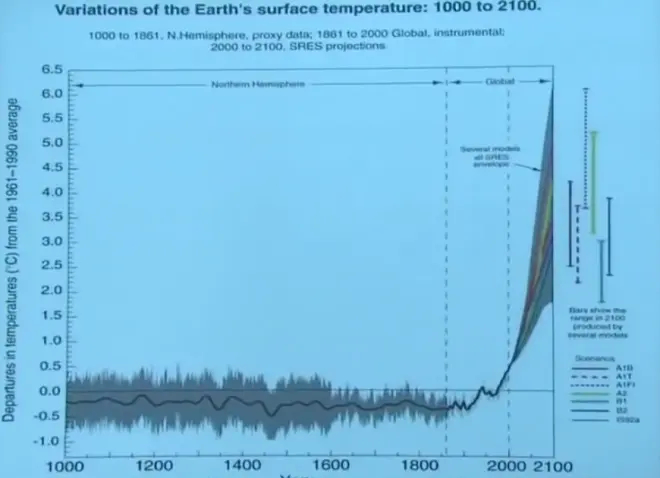
Now when you plot the same data on a larger time frame, going back 1000 years, so here we are today. So what they've done is taken that historic proxy data that I've shown you before, with a little bit of a hint of a medieval warming, and a little bit of a hint of a little ice age in here, and then our current kind of two phased warming in the 20th century, and then put these IPCC scenarios tacked on to that, it helps you to put in perspective as to how the changes relate to what we've seen over the last part of the Holocene period. It's quite a steep and dramatic rise compared to the flat climate we've had recently.
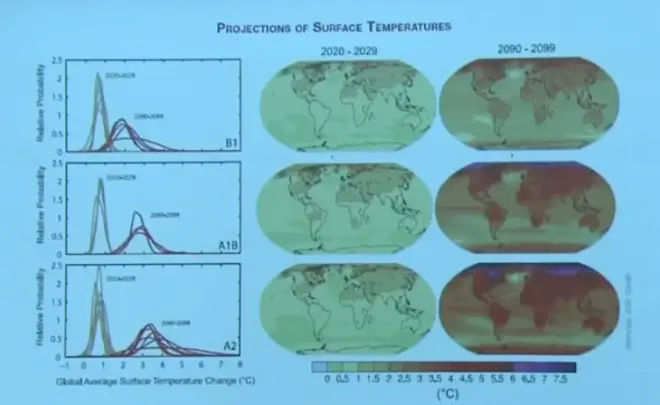
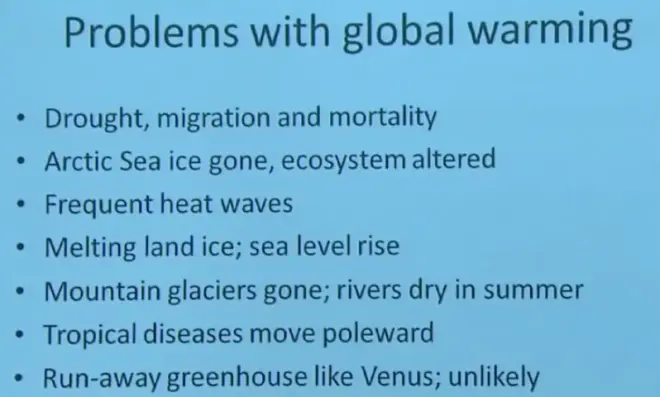
And of course it won't be uniform, the warming. Here's the warmth they anticipate under three of the scenarios, B1, A1, B and A2 up from 20 to 29, most of the warmth is in the northern hemisphere. Up to the end of the century then, much more warming, but again concentrated in the northern hemisphere, high latitudes. Values as high as 7 degrees Celsius. My god, that's a lot of warming. That's an amazing amount of warming. Certainly there would be no arctic ice. Certainly there'd be no glaciers in the northern hemisphere, mountain glaciers, under that climate.?
Problems Connected with Global Warming [00:36:48]
Possible Advantages of Global Warming [00:42:29]
There are advantages however. There are vast regions in the northern hemisphere, especially Canada and northern Asia, where agriculture is mostly limited by lack of summer warmth. And so you would find greatly increased agricultural productivity in Canada and Asia under these IPCC global warming scenarios. Also at the present time, many more people die from cold every year than from warmth. And of course, my heating bill will be less.
And it's now known and well documented in the literature that when CO2?concentrations rise, plants grow more quickly because of what's called CO2?fertilization. And so crops will grow generally more quickly. Some would argue that the crop—the nature of the plant structure however changes and makes that plant material less nutritious. So be careful. It's not only the mass of the plant that you grow, but whether--if you're going to eat it, whether or not it's nutritious for humans. So be a little bit careful on that one. But there's no doubt that CO2?fertilization is already being seen in forests and in agriculture. So that's a real factor, a real positive factor.
Actions that May Reduce Global Warming [00:44:03]
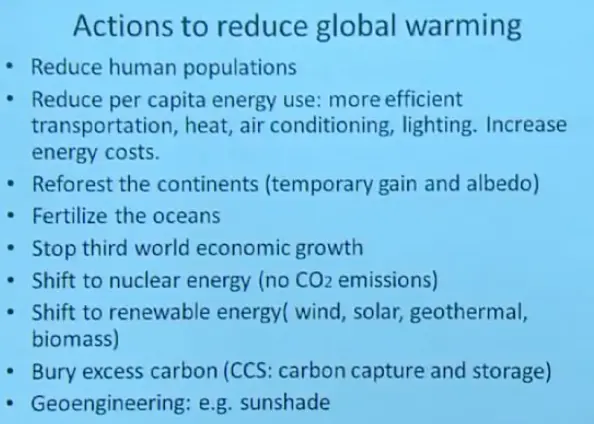
Reforest the continents, because when you grow a tree, you sequester a certain amount of carbon dioxide. There are a couple of problems with that. I've mentioned one of them already. A tree typically only lives 60 or 100 years and then it will die and that carbon dioxide will be returned. Within 20 years, it'll be back in the atmosphere. So it's not a permanent way to store carbon dioxide.
And also recently in the literature, it's been pointed out, and it's really quite obvious when you think about it, forests are very dark in their coloration. Their albedo is very low. And so if you add more forest, you decrease the average albedo of the planet, which would warm the planet. So be careful about that trade off.
Fertilize the oceans. For a while we were talking about putting iron into the oceans, because that turned out to be a limiting nutrient for phytoplankton growth. And phytoplankton draw in CO2?just like plants on land do. The question once again though, how long would it stay in the oceans? Would it fall to the bottom to be covered over, or would it just return back into the atmosphere.
Shift to nuclear energy. Nuclear energy does not emit any carbon dioxide. Shift to renewable energies of various types, wind, solar, geothermal. I'm going to be talking about these, by the way, in the last week of the course. We're going to talk a bit about renewable energy.
The big thing that's talked about these days is CCS, Carbon Capture and Storage. It's removing carbon dioxide from the atmosphere and burying it down deep in the crust of the earth. A lot of research is being funded, including a big grant here in the geology department at Yale to work on some aspects of this. The question is--one of the questions is would it stay down there? I mean it's light material. You'd like to combine it or condense it in some way that it's stable and would stay down where you put it. But after all, it is a material that would like to gasify and come back out. And so there again I would worry about how long it would stay buried down there. And then various geoengineering hypotheses have been made, such as constructing some kind of a shade over the earth to prevent some of the sunlight from reaching the earth.