19. Ocean Bathymetry and Water Properties
GG 140: The Atmosphere, the Ocean, and Environmental Change

Lecture 19.?Ocean Bathymetry and Water Properties

https://oyc.yale.edu/geology-and-geophysics/gg-140/lecture-19

Plate Tectonics [00:00:00]
We'll talk about the bathymetry of the oceans. The word bathymetry here means the study of the ocean depth.?That ties very closely to plate tectonics.?It's the modern paradigm to understand how the continents were formed, and the oceans are formed, and a number of the things you see in rocks.?
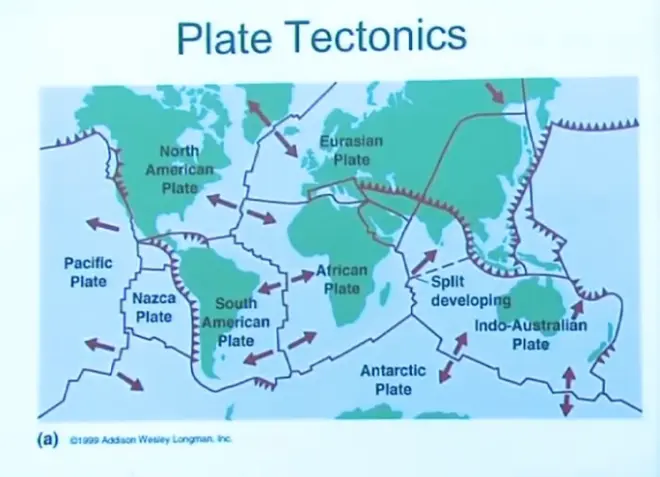
The basic idea behind plate tectonics is that the spherical skin of the earth, this shallow layer called the crust that's rather rigid floating above a deeper semi-liquid mantle, that crust is broken into several discrete plates. The Indo-Australian plate, the African plate, the South American plate, and those plates, as they move around remain rigid. And so the interactions, or the interesting parts, occur at the boundaries where one rigid plate butts up against another and some kind of interaction occurs. Maybe it's a subduction zone, maybe it's a?new plate material being formed, but that's the way we try to understand the structure of the earth these days is to understand where are these plates, and how do their edges deform as the plates move around.
So for example, that boundary there is a mid-ocean ridge, or a so called mid-ocean spreading center, you can tell that from the arrow. So new ocean crust is being formed at that point, and so this plate is moving away from that plate at a certain rate. Up here in the North Atlantic as well, you've got the plates pulling away from each other, and new ocean crust is being formed. That?symbol, for this artist, is referring to a subduction zone, where one plate is being drawn down under another. And so crustal material is being disappeared, it's being returned down into the mantle of the earth.
Notice that some plates are consisting of ocean only, some plates are consisting of a combination of continental crust and ocean crust. So that's the basic idea behind plate tectonics. For example, this large Pacific plate, fairly rigid and giant in size, is ocean crust only. Whereas most of the others, not the Nazca plate, but the Australian plate, has ocean crust plus continental crust. The Eurasian plate has both, North American plate has a big chunk of ocean in it.
The thing that preceded this, was the theory of continental drift. Continental drift was the idea that people noticed this nice jigsaw fit, for example, Between South America and the bite of Africa. Or the way this coast kind of could fit in against here. Or the fact that the rocks here, were similar to the rocks there up in Scotland. So the idea was that, early on, that the continents may have moved. But the early idea was that they moved through the ocean, the continents plowed their way through ocean crust to move around on our planet.
However that was soon found to be incorrect, because the physics of trying to push a continent through ocean crust was shown to be impossible. Instead this is the vision that now seems to be the right one, where you've got plates sometimes consisting of continents and oceans. They move relative to another, relative to one another, and all the action is right at their boundaries, where there’s creation of new crust or the destruction of crust. So this is the conceptual model that seems to fit all the data that we have.
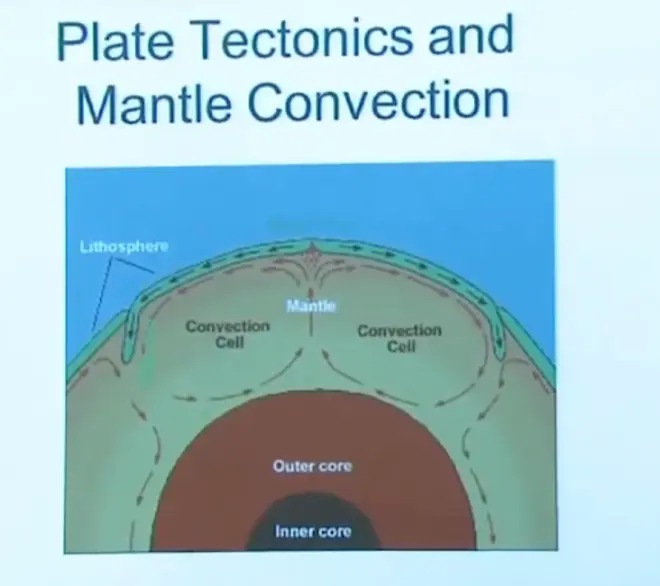
And what would drive that kind of motion, well it's basically part of the mantle convection. So there's heat being generated in the interior of the earth, by the decay of radioactive elements, like uranium and so on, decays naturally, releases heat. The interior of the earth heats up, and that destabilizes the lapse rate. It basically, if you're heating this fluid from below, you're destabilizing it and convection begins. And as part of that convection cell, then you get spreading centers for the crust and then subduction zones where some of that crustal material is drawn back into the mantle, and melted, and returned. So it's not a crust only phenomenon, it's driven by mantle convection, but for our purposes we're interested primarily in what it does to the crust of the earth.
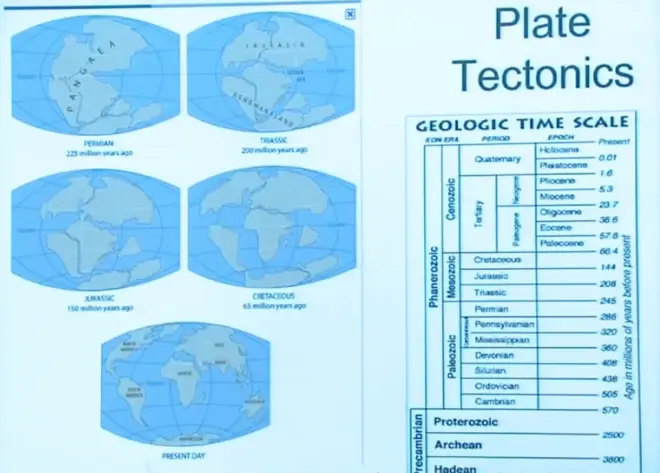
So going back into geologic time, we can see this happening. So here's the present day, and then we go back in time to the Cretaceous, the Jurassic, the Triassic, and Permian. Here's a geologic time scale, the age of the earth, this is in thousands--in millions of years, the age of the earth is back here around five, roughly five billion years ago. And the first one of these diagrams that the artist is showing is the Permian, which is about 255 million years ago. At that point all the continents were together?in a giant super continent called Pangaea.
And then as time progressed it split up, first with a seaway that came through this way, and then eventually you begin to get the Atlantic ocean opening up, and today you have something like this. So we're going from 255 million years ago for the Permian, and then stepping forward to the Triassic, the Jurassic, the Cretaceous. So when the dinosaurs roamed the earth, it was in this stage. Humans never saw this configuration, humans evolved just in the last couple of million years. So we've been looking at that structure for our evolutionary history.
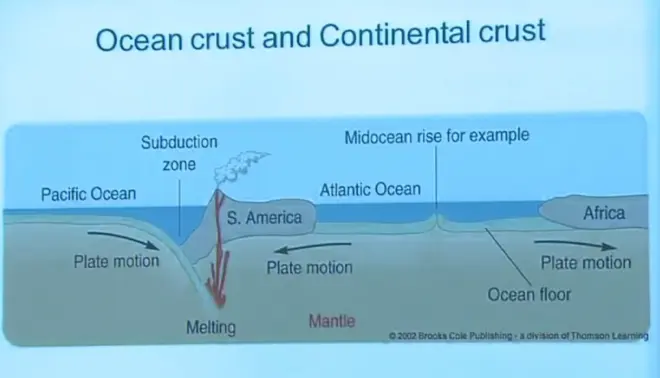
Now, so what does this mean for the structure of the oceans and the continents? There's South America, so this is an east-west, section through the South Atlantic ocean. It shows the Pacific Ocean plate, which is continental crust being subducted below the mountains of South America. As that material is drawn down into the mantle, it melts. As it melts, some lava, some magma, has come off of that. That then make their way upwards to cause the volcanoes along the west coast of South America. Otherwise the rest of that material is just lost down into the mantle.
When you get over into the Atlantic Ocean, there's a rigid boundary there that's part of the same plate. Continental crust, and ocean crust, part of the same plate, but there's a spreading center. That's where molten material is coming up again and solidifying as it cools to form new ocean crust. So this is moving away, while new ocean crust is being created right at that point. And then over here, that's a rigid-rigid connection, so that once again is part of the same plate with no crust being lost or gained at that particular boundary.
But the point I want to make here is that there are two types of crust. Continental crust is generally of a lighter material, and floats a bit higher in the semi-molten parts of the mantle, whereas the ocean crust is a little bit denser and floats a bit lower. So you've got basically a lower floating ocean crust here, and a less dense higher floating continental crust. And then when you fill that with water--the water has nothing to do with this of course, but the addition of water makes it seem like an ocean to us.
There happens to be enough water in the ocean to generally cover the ocean crust, but not to cover the continents. Now if there were twice as much liquid water available on the planet, that distinction would be less important because the water level would be here, and it would cover both the ocean crust and the continental crust. But with the amount of water that we have, it means that the continental crust usually sticks above sea level and the ocean crust does not, it's submerged below sea level.
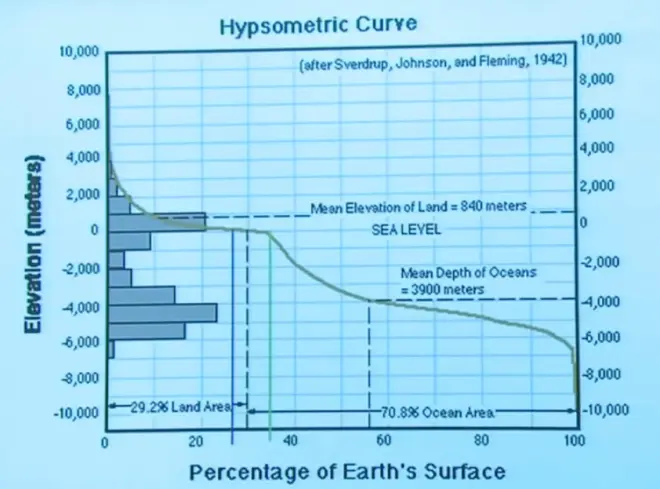
When you then take a, what's called, make a hypsometric curve, I'm going to focus on the bar graph over here on the left. This is elevation in meters above and below sea level, sea level is marked at zero here. Which I remind you is a somewhat arbitrary choice, it depends on how much water we have in the oceans. And over geologic time, that has probably changed a little bit. For example, when you have an ice age you store some of the water up on the continents in the form of glaciers, and sea level drops a little bit.?
Whats shown in the bar graph then, is the percent of the earth's surface that lies, for example, Between sea level and one kilometer above. And it's about 20% of the earth's surface. Between one kilometer and two kilometers above sea level, it's about 5% of the earth's surface. And you find some parts on the continents that are even higher, even up to four, but you know in fact Mount Everest is up here somewhere, there's even a little bit of land that lies 9000 meters above sea level.?Going down below sea level, you find there's not much land at one kilometer, two kilometers, and three kilometers below sea level. But a lot at four, five, and six kilometers below sea level.?
This is a surprise because if the earth was just a rough surface, had been roughened by some process, it would have kind of a normal distribution for this hypsometric curve. It would have some average height, and then less above, and less below.
But?no, this has a?double peak. And of course that has to do with the point I already made. There are two types of crust here, this is continental crust and this is ocean crust. So this plate tectonics that gives us the two types of crust, ocean crust and continental crust, is the cause for this double peak in the hypsometric curve for land elevation. And again it just so happens that we have an amount of water that puts most of this down below sea level, and some or most of the continents just at sea level or slightly above.
Ocean Bathymetry [00:17:12]
Now we can turn to the particular features, bathymetric features in the ocean.?So you take a ship, and it sends out an acoustic signal, a sound wave, and you bounce it off the bottom and you time how long it takes that signal to go down to the bottom of the ocean and back up again. And in the old days you just had a single pinger going right directly down, so you'd have to take the ship back and forth on a very complicated long route to map out the ocean. But now, they can send it out in a fan with different acoustic beams going in different directions, so you can do a single swath as you go along and get depth over some range to your left and to your right as the ship sails along.
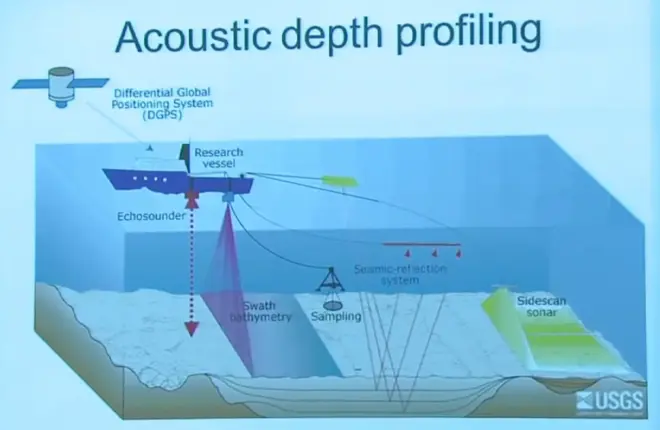
Sound moves rapidly in seawater, the speed of sound in air is about 300 meters per second, speed of sound in water I think is three or four times that, it’s really--it goes quite rapidly. Nonetheless it's still a finite speed, and you can easily time how long it takes for that acoustic signal to get back to your receiver and get the depth from that.?
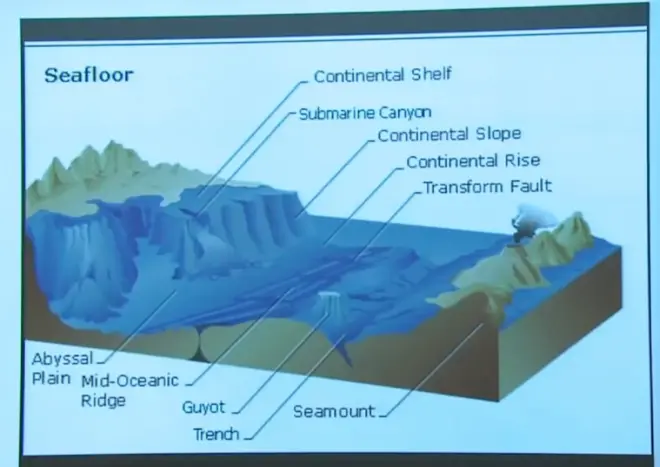
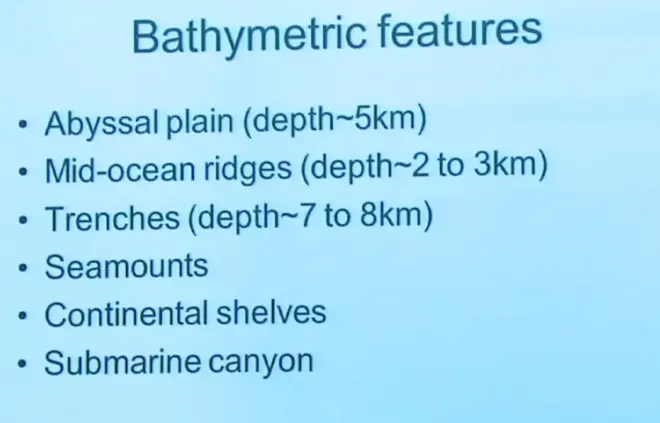
There's a section of abyssal plane, that kind of flat lying section. Flat in part, because it's composed of sediments that have fallen from above, and as they fall they fill in the cracks first, and then as you get quite a pile of sediments it tends to give you a flat surface. A mid-ocean ridge, one of these spreading centers where magmas are coming up and forming new ocean crust, tends to be elevated because those rocks are still hot, and less dense, and they float a bit higher than cold ocean crust until they cool down. And then they sink a little bit away from the spreading center. But that could come up a bit, if this abyssal plane is at five kilometers, then this mid-ocean ridge might only be two or three kilometers below the ocean surface.
You can have undersea volcanoes.?Undersea volcanoes build up from the ocean floor, and in some cases they will not reach the ocean surface, in which case they're called seamounts.?Usually the word seamount is confined to an undersea volcano that has not reached the earth's surface.
On occasion you find them with flat tops, which means that at one point they reached the ocean surface and were leveled by wave action. And now they've settled back down a little bit, so you'll find undersea volcanoes some of them with a flat surface, those are called guyots. And then the ocean trenches, where you get the subducting plates, are the deepest parts of the ocean generally.?
Then I wanted to make this point about a continental shelf. So there's a continent, there's a continental shelf, there's the drop down to the abyssal plane.?You see then geologically, a continental shelf is really part of the continent. It just so happens that the water level is high enough so it's covered up slightly some of this, making it appear on a map of the earth that its ocean, but geologically it is continental. This is going to be a very shallow ocean, probably only 100 or 200 meters deep. Whereas this is five kilometers deep, so it's going to be pretty clear to separate geologic continental structures from geologic ocean crustal structures. Because they really are at a very different level, even though there's enough water at the present time, especially with the glaciers mostly melted at this time to make a little thin layer of water covering those continental shelves.
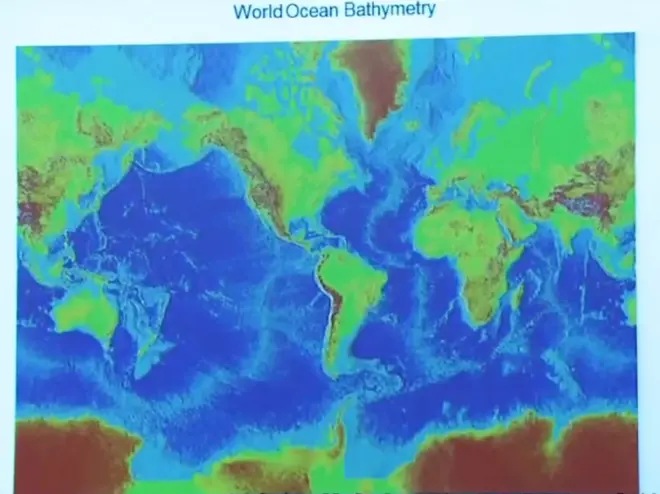
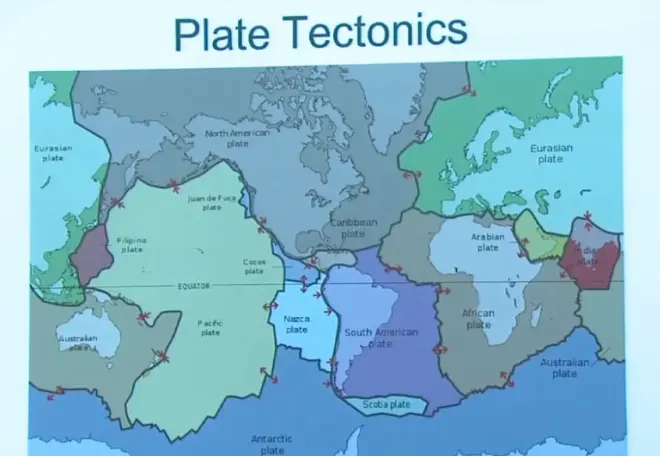
So now here's the whole, the whole world ocean, and the color scheme is not quantified on here.?All the deep blue is abyssal plane, about five kilometers deep. And you see it a lot of places. These little lines that run up through the middle of oceans, for example in the South Pacific and all the way up through the Atlantic, the south and the north Atlantic, those are spreading centers, mid-ocean ridges. And then the trenches don't show up well on this diagram, but they are the darker blue still. And you see a little thin line along there that's a trench, you see one here, you see an important one here, and up along here, and even along the tip of Aleutian Islands.
So this is the geometry in which then we'll be studying ocean currents and so on. It's going to be constrained by this pattern of depth, and the thing that's going to be very important to us is the way that these continents tend to break up the oceans into segments. For example, Asia with Australia included, and North and South America, break up the Pacific ocean into kind of a north, south, oriented ocean. North America, South America, compared with Europe and Africa, break up the Atlantic again into a north, south, oriented ocean. The Indian Ocean is a little bit different because Asia fills the northern hemisphere, most of it, down to about say 20 degrees north latitude. So the Indian Ocean is primarily an ocean just in the southern hemisphere.
And then, the one gigantic exception to this is the so-called Southern Ocean. The term for that strip of ocean that goes all the way around the globe, it's usually called the Southern Ocean in oceanography. And if you go far enough south in the Pacific you join onto it, the Atlantic you join onto it, the Indian you join on. And as we'll see, you can have ocean currents here that go right around the globe. Whereas at all these higher latitudes, any ocean current that moves east-west is going to hit a continent and is going to have to wrap back around. So you get what are called gyres, in most of the oceans, because they're confined by these north-south oriented barriers.?
Measuring Ocean Surface Water Properties [00:30:00]
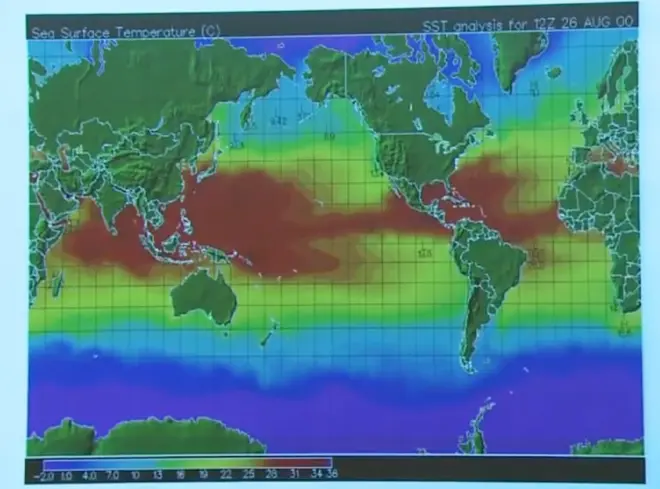
So here is a map taken in late August, I think of the year 2000 from satellites, showing the sea surface temperature, SST. The color is in Celsius, and you see that in the tropical regions you're getting up to temperatures 28 and higher. Remember 27, 28, was the threshold for hurricanes. So you are getting a lot of warm ocean temperature that support hurricanes, some of that however is right at the equator and so you couldn't have hurricanes forming there because you don't have the Coriolis force.
But in other parts you get the warm water extending far enough away from the equator, so you could have hurricanes. I pointed out when we were talking about hurricanes, two interesting places. The Western tropical South Pacific, where you don't have hurricanes because it's too cold, and you see it there. It's a cold ocean current, the Humboldt Current coming up here, taking cold water from the Southern Ocean, peeling some of it off, bring it up here, and keeping that part of the world ocean cool. And you see something very similar here, where cold waters being peeled off and come up here to keep the southern tropical Atlantic a bit cool as well. Otherwise it's pretty warm in the tropics, except where you're getting these cool currents. The California current does a little bit of cooling in this region, and the return from the Gulfstream does some cooling on the eastern side of the north Atlantic there, so that's that now.
But if you get a mental picture of this, be very careful what you do with it, because you could be very much misled. This is sea surface temperature, when I go down even just one kilometer in the ocean, or especially if I go down to the ocean bottom, it looks nothing at all like this. So temperature is not vertically homogeneous. As I'll show you later on, this warm water that can form near the tropics, forms a rather thin layer floating on the cold water that fills most of the world ocean. So this is not a picture that can then be transferred down into the ocean very deep at all.?
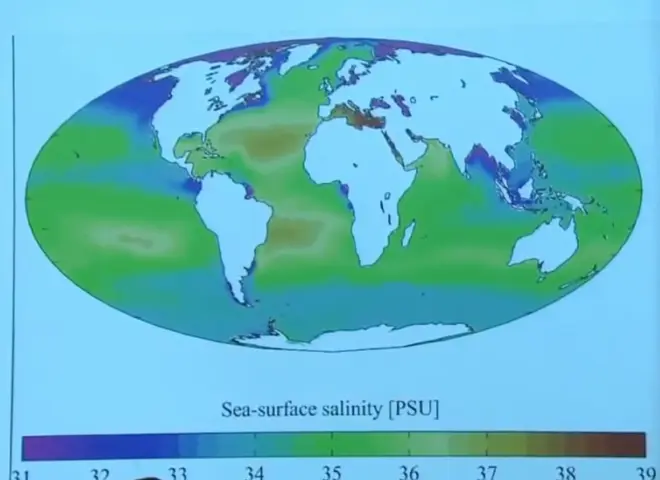
Salinity is the other important property we track in ocean water, and here's a map of the sea surface salinity. So just the surface, just the salinity you would measure from a ship if you took a surface sample of water and analyzed it. And well, the most remarkable thing is the narrow range. And you get some salinities as fresh as maybe 31 or 32 parts per thousand. And some, perhaps in the Mediterranean Sea, and the Red Sea, Gulf of Aden perhaps, getting up to 38, 39. But generally that's the full range of ocean salinity. It only goes about plus or minus four parts per thousand around that mean value of 35 parts per thousand. The reason for this must be that the ocean mixes itself occasionally, to maintain this kind of rather homogeneous salinity. At least compared to the rate at which you're adding freshwater, or the rate at which you're adding or subtracting salt.
So the basic story behind this narrow range of salinity, is that the ocean is, at least for salt, relatively well mixed. Now if it were completely well mixed, it would have the same salinity everywhere. If it were vigorously being stirred, like a vigorous spoon stirring in a pot, any differences would be immediately removed. So it's not perfectly well stirred, but is reasonably well stirred, giving you this rather homogeneous salinity over the world ocean.
So that's lesson number one, but at the next level though of detail, we can notice that there are some variations. And they probably make sense to us because it’s in these--it's in the so called Intertropical Convergence Zone, or the belt of tropical rainforests, that you get a little bit lower salinity. That's right through here, and you see it here, and a little bit down through here. So there's a lot of rain falling on the ocean there, fresh water coming down and diluting the salt a little bit, giving you a smaller salinity along the equator.
And then as you move north and south from that into the belt of deserts, the descending branch of the Hadley cell, with very little precipitation and some evaporation. Remember when you evaporate seawater, you leave the salt behind, and so the salinity is going to be increased. And you see the increased salinity there in both the Northern and Southern hemisphere, connected with the belt of deserts. And then you get up in the mid-latitudes and once again you've got the frontal storms, cold fronts, warm fronts, bringing rain and that once again dilutes the surface salinity.
Measuring Deep Water Properties [00:37:37]
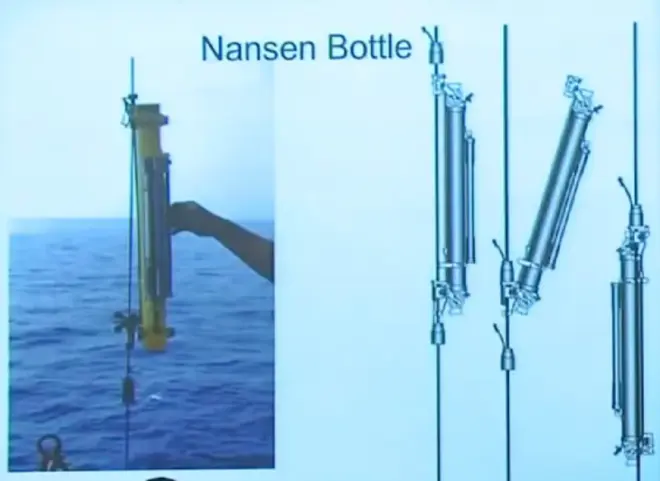
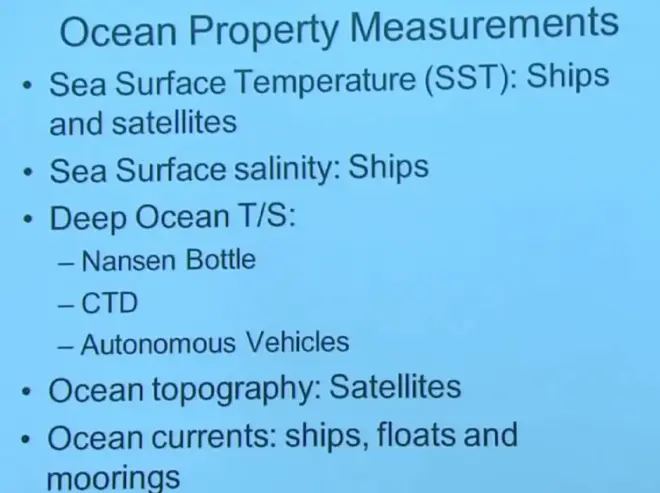
Now I want to tell you about?how we measure ocean properties down into the ocean. The old way to do this, and I'll talk about the new ways too, the old way for about 50 years, the predominant way for sounding the ocean, for getting temperature and salinity profiles with depth, was the Nansen bottle. And here's a diagram, here’s a picture of one, mounted on a cable that's about to be put down into the ocean. It's put down into the ocean and is triggered, so that it tips over and the valves close on it.
It was designed by the famous Norwegian explorer Fridtjof Nansen. And it is composed of a hollow metal tube, fairly thin and its steel, with a valve at the top and the bottom. And there is a tie rod that connects the two valves, and so when this tie rod shifts relative to the bottle itself, it'll close both valves simultaneously.?
I'm pushing this thing down, and as I do so it has fallen away to an orientation like this, and now both valves are closed, trapping water from that level. So when it's brought up, you've got samples of the water at each of these depths. Also, when you flip over these thermometers, they're so called reversing thermometers, and when they're flipped over the mercury column breaks, and so you lock in the temperature at that depth. And when you bring it up, you've got a record of what the temperature was at that depth.
So by flipping it over, you lock in the temperature, and by flipping it over and closing the valves, you lock in the sample of water from that depth. Then over the next couple of hours you bring that cable back to the surface, and each time when a Nansen bottle emerges, you reach over, diSconnect it, and put it in a rack. And after several hours of work, you've got data from the whole sounding. And over a period of 50 years or so throughout the 40's, 50's, 60's, 70's, and 80's, this was used to map out most of the world ocean in terms of its temperature and salinity structure.?
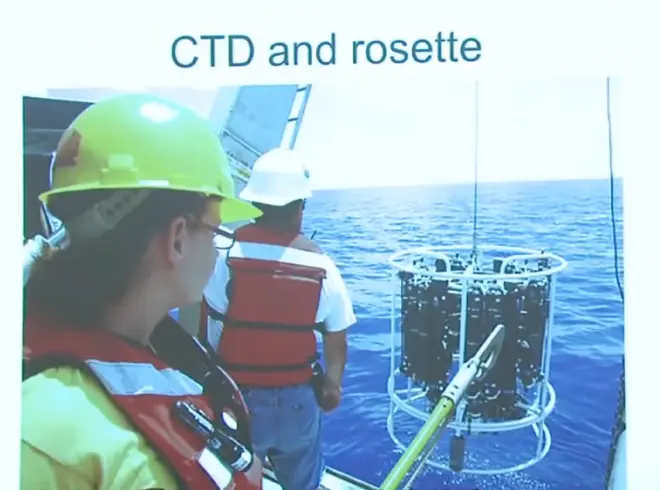
It's important historical, but also to understand how that was done. Today it's done a bit differently, it's done with a CTD and a rosette. Now CTD is an abbreviation meaning conductivity temperature depth. It's an electronic device, the conductivity part is similar to what we did on the river lab. As you lower this thing down into the ocean, it measures the electrical conductivity and from that you can determine the salinity. It also has a thermistor on there, so you can measure temperature, and it's got a pressure sensor on there so you can measure depth. So as you lower this down, in real time because there's a cable coming back to the surface, you're getting a detailed profile of temperature, salinity, and depth.?
However that of course would not give you a water sample, so if you want to do any kind of water chemistry a CTD would not be sufficient. The beauty of the old Nansen bottle was, you got a water sample as well. So if you later on decide you want to do any kind of chemistry, you had that water sample. The CTD is a great advance on that, but it doesn't give you the water sample. So what's usually done today, is that they have a set of water collecting bottles arranged around the perimeter, and that's called the rosette. And they've got an electronic control, where the valves on these can be closed on command.
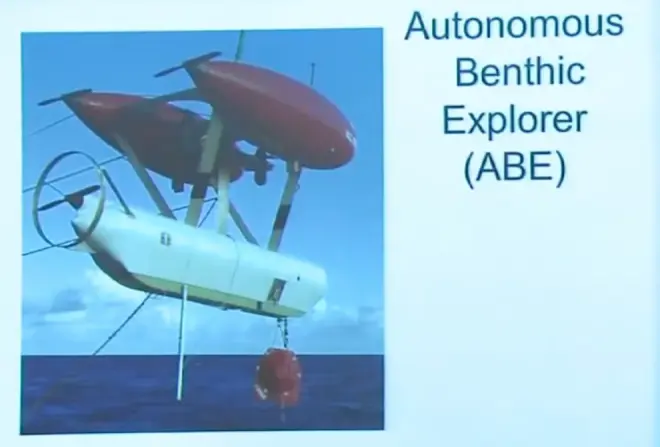
So now the field is moving in the direction of these autonomous explorers, where it's an unmanned vehicle that you launch from a ship but then it pretty much goes its own way, and you can control it.?You talk to it with sonar, sending acoustic signals to it which it can receive, and it will then cruise around in the ocean up, or down, or laterally, measuring. Of course you don't get water samples from this but you get temperature, conductivity, and depth, because this has a CTD on board. And you can control it and move it wherever you want, back and forth. In one area, if you think conditions might be changing, or traversing larger parts of the ocean, if you want to map out a big piece of the ocean volume.