21. Ocean Currents (Exam II review)
GG 140: The Atmosphere, the Ocean, and Environmental Change

Lecture 21. Ocean Currents

https://oyc.yale.edu/geology-and-geophysics/gg-140/lecture-21

Review of Exam 2 [00:00:00]
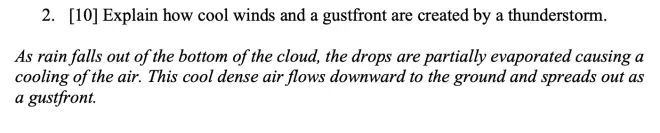
The basic idea there is you get rain coming out of the base of the cloud. You know that below the cloud, the relative humidity is less than 100%. So as soon as that rain falls below cloud base, it's going to begin to evaporate. Now maybe only a small fraction will evaporate, maybe all of it will evaporate.
Whether it all evaporates or just some of it, it takes heat to evaporate water, and so—and that heat comes out of the air. So there's a cooling that takes place, an evaporative cooling that takes place just below the cloud base, and that takes air and makes it cooler and more dense. So it then falls out of the sky until it hits the surface, and then spreads out. And the front of that is called the gust front.
So the basic idea here is that evaporation of raindrops below the cloud base cools the air, makes it sink and spread out. So that's the idea behind--if you've experienced this in the summertime, you hear a thunderstorm in the distance, and then for a few minutes later the wind begins to pick up. It'll be a cool wind, typically, and blowing from the direction of the thunderstorm. That's that cool air coming down from the base of the cloud.

Explain why the sky Appears blue, but a cloud Appears white under similar illumination from the Sun. So the idea is we have our observer. We have a cloud here. And the Sun is illuminating the cloud, but is also seeing radiation that's been scattered. Some light is scattered out of this beam coming directly to the observer, and that's blue light. But this is white light.

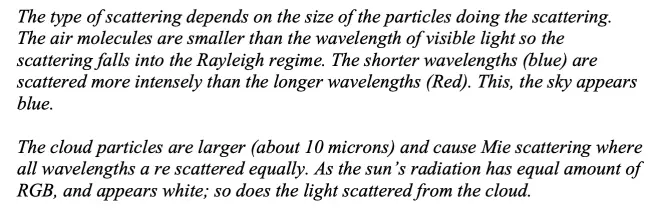
Short wavelengths are scattered much more strongly than longer wavelengths. The part of the spectrum we can see with our eye, the visible part of the spectrum has red, green and blue. Blue being the shorter. Red being the longer wavelength. So in Rayleigh scattering where short wavelengths are scattered more strongly, that'll be the blue light that's scattered more than the green and the red. So this light scattered out of the Sun's beam to your eye by molecules is going to be dominated by the blue light.
For the cloud itself, the particles are much larger. They're the cloud droplets. They fall into the category that the wavelength is the same order of magnitude as the cloud droplet. Which puts us into the Mie scattering range where all wavelengths are scattered equally. So whatever color was illuminating this, you'd have the same color coming out. So if it's white light illuminating the cloud, and the Sun's radiation is usually composed of roughly equal mixtures of blue, green and red, so that would Appear white to our eye. Then the light scattered by the cloud is also going to be white.
By the way, if you have a setting Sun illuminating the cloud where some of the blue light has already been scattered out, it may be that the cloud is illuminated by red light. In that case, the cloud would Appear red as well. But the point here is that under Mie scattering, it scatters equally whatever is illuminating the cloud. So it'll keep the color the same as it scatters radiation from the cloud.
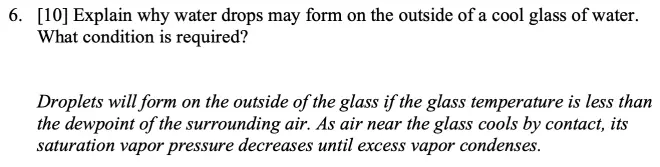
And the key condition is that the temperature of that glass, if it's less than the dew point of the atmosphere around it, then you will get condensation. The idea is that the glass will remove heat from the air adjacent to it, drop the saturation vapor pressure down, and if it can drop it low enough, it can drop the temperature down below the dew point, then you'll bring water out of the vapor state and condense it on the outside of the glass.?
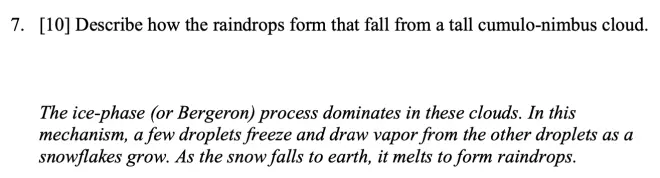
How do the raindrops form that we find falling from a tall cumulonimbus cloud? In the summertime you get tall cumulus clouds with heavy rain out the bottom. The fact that they're tall means that the top part of it is certainly going to be at a temperature lower than zero degrees Celsius. So there's going to be super cooled water up here.?
So using the ice phase mechanism then you can convert these to snowflakes. They'll fall, when they fall below the zero degree line, they'll melt and form raindrops and then they'll fall to Earth. So what you had to say there was to mention, at least mention, the ice phase mechanism because that's how the hydrometer would be formed. And then you had to describe how it would melt on the way down to form a raindrop.
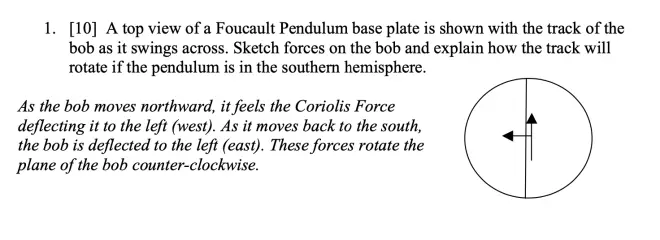
Jerusalem has a--it's in the Northern Hemisphere. Wettest month is January, and notice from the temperatures, that's also the cooler month. So Jerusalem gets a wintertime rainy season, and that is clearly due to the southward shift of the polar front. So what's hAppened is that during the winter season, this polar front has moved southward and is giving you frontal cyclones that come through that latitude and give you the rain.
In Asuncion, Paraguay, Southern Hemisphere, the wettest month is December. In the Southern Hemisphere that's summertime. Notice also from the temperature that that's the warmer month. So you know immediately that is a summertime precipitation maximum. And that guarantees that it's going to be a southward shift of the ITCZ, giving you precipitation there. So the ITCZ in the Southern Hemisphere summer moves across the Equator into the Southern Hemisphere and brings precipitation to Asuncion.
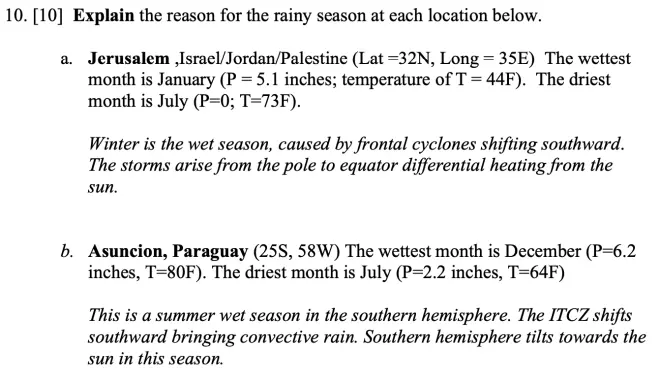
Atmospheric Forcing of the Ocean: Wind Stress [00:23:54]
Basically the ocean is driven by the atmosphere above it in these three ways. Heat added, and taken away, fresh water added and taken away, and the wind stress. We can quantify this, and recent investigators have tried to do this by producing maps, in this case, of the heat flux in and out of the ocean, or the water flux in or out of the ocean, or the wind stress Applied to the ocean surface.?
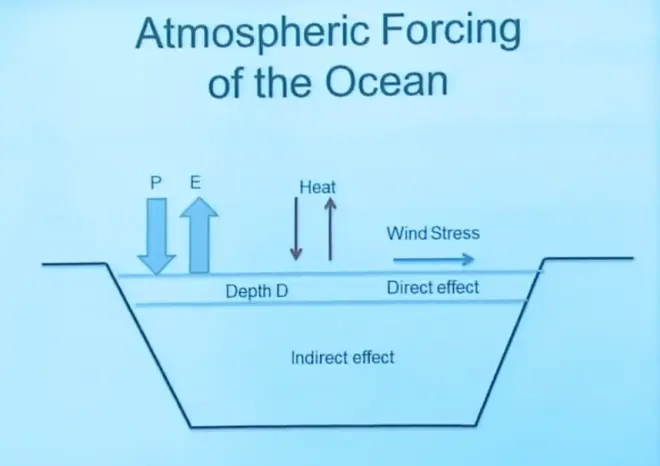
And last time I derived some formulas for this, how a layer of depth D, which will feel the direct effect of this forcing, would respond to fresh water, heat, or wind stress. For the wind stress,?the concept involved this Ekman layer. When the wind blows over the ocean and puts a frictional stress on it, the first few tens of meters or hundreds of meters responds to that directly, but in an odd way.
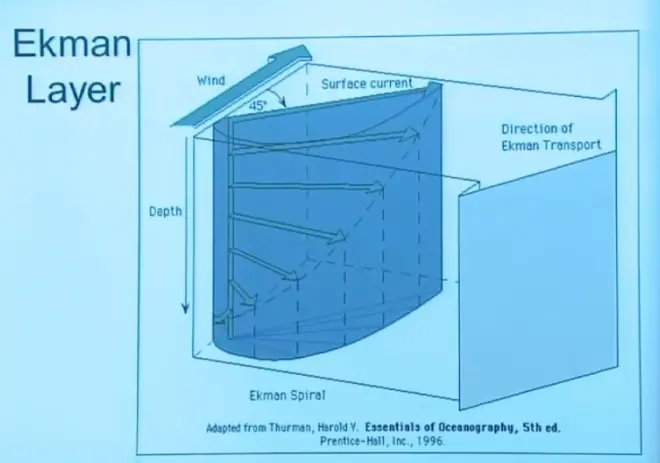
It has a spiral with depth. If you average that out, the net of all that motion is directly to the right of the wind stress. That's this big arrow here. That's the direction of Ekman transport, exactly at right angles to the wind stress that’s being Applied.?So if you had a wind?from the southwest to the northeast, giving you wind stress in that direction--that's the black arrow--and you gave it a few hours to come into this new state of balance called the Ekman force balance, that force would be balanced by the Coriolis force, and if that's going to be the Coriolis force, then the Ekman transport must be in that direction. So the CF is at right angles to the net Ekman transport.
Now, this is not identical with the geostrophic balance. Geostrophic balance was a balance between Coriolis force and pressure gradient force. I have no pressure gradient force in this problem. This instead is a balance between a frictional stress being Applied to the ocean, and the Coriolis force. But it's very real. If the wind is blowing briskly from one direction you can measure the surface water moving off in the right direction.
The same thing Applies to icebergs. When the wind blows on an iceberg, it moves at right angles to that force. The old sea captains would make notes of that in their log. Winds are from the south today, but the icebergs are moving off to the east. It has to do with this kind of a balance including the Coriolis force.
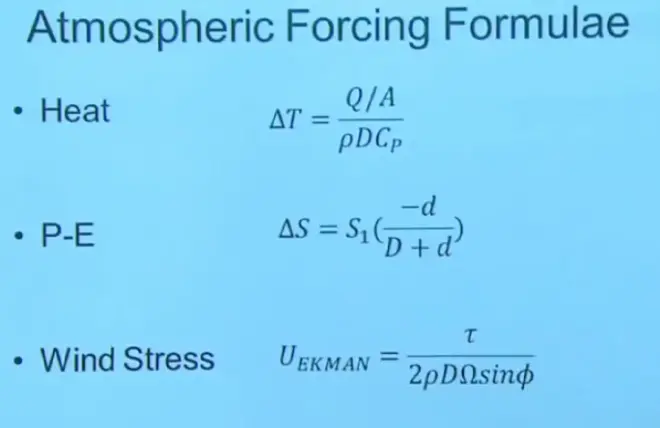
If you added an amount of heat per unit area Q over A, you can compute how the temperature of some depth D will change. If you add a layer of fresh water to the ocean of thickness little d, and then you mix that in to some layer of depth D, there's how the salinity will change. If you put a wind stress τ on the ocean, and that is mixed down to depth d, that's what the speed will be of that Ekman flow that goes off at right angles. Yeah.
Chapter 3: Thermohaline Currents [00:29:38]
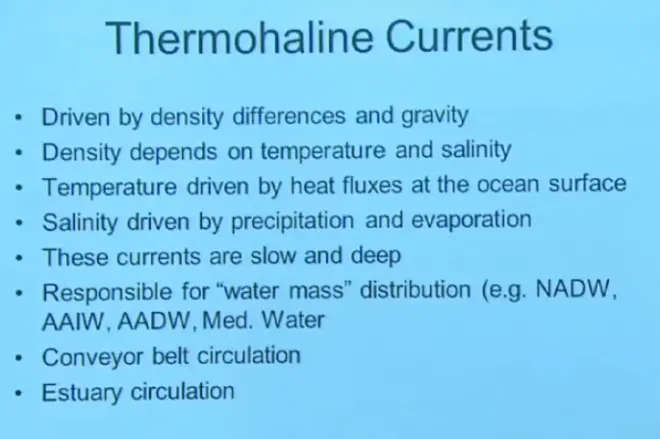
The heat and the fresh water input, will modify the temperature and the salinity. The temperature and salinity will in turn change the density of the seawater. And then gravity will act on those density differences to produce currents down in the ocean. And those currents are called thermohaline currents. The name reminds you is they have to do with heat and salt. But they're acting through the role of heat and saltin controlling seawater density.
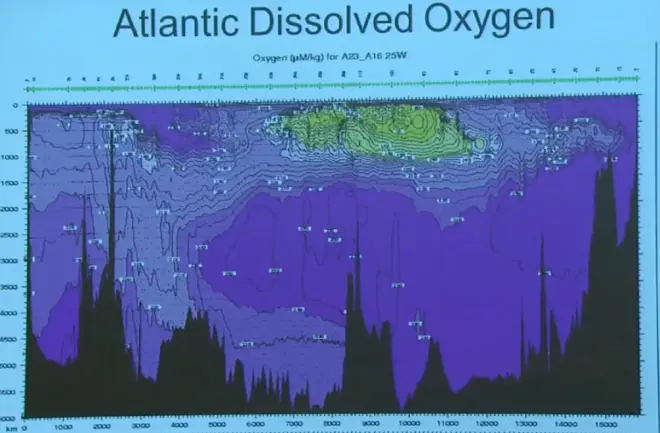
Typically these currents are slow and deep. As I will show you in the next few minutes, they are responsible for the water mass distributions in the ocean, for the conveyor belt circulation, and for example, also for estuary circulation. So these are very important circulations in the ocean, even though they tend to be rather slow in the speed of their motions. These are the thermohaline currents. So let's take a look at the Atlantic Ocean along this section of 25 west longitude.?
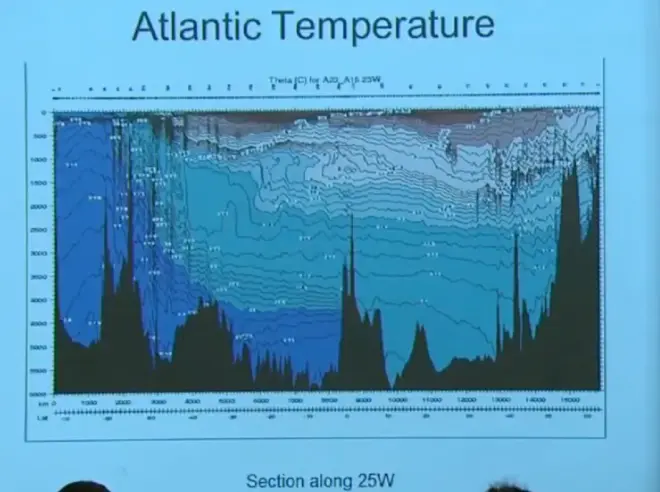
Here is a temperature?section?given where this goes north to south, sea level down to 6,000 meters. And the black?is the terrain.?The first thing that strikes you about this image perhaps is the steepness of this terrain. Are there really these sharp spikes and cliffs in the ocean? And the answer is that when you make a diagram like this, there is a lot of vertical exaggeration. For example, that distance is 5 kilometers or 6 kilometers, whereas this distance is something like 15,000 kilometers.?Where I could squish this down or stretch this out, these supposedly steep slopes would become very, very gradual. Probably only 1% or 2% slopes.
Now, for the temperature itself, you can't read the labels very well, but some of these are slightly negative, temperature of minus 0.02—sorry 0.2 or 0.4. If I've got a temperature of minus 0.4 Celsius. It's not super cooled water because the salt actually depresses the sea level by a degree or two. So in fact, you can have a temperature down to maybe minus 1 or 1 1/2 degrees Celsius, and still be above the freezing point because the salt has suppressed the freezing point slightly. So this is not super cooled water. It's not about to freeze if you introduce some kind of a freezing nucleus to it or something.
I want you to notice this band of blue coming down here. We're going to identify that as Antarctic Bottom Water?,AABW. It's very cold water that's formed where the ice sheets from Antarctica float out over the ocean and cool the ocean down. And that water becomes so cold and so dense that it falls to the bottom of the ocean and then spreads northward. In this diagram it reaches the Equator.
In some other sections, it actually gets a little bit north of the Equator. This is amazing. So a water mass formed under the ice shelves of Antarctica falls to the bottom of the ocean, and then under its own weight slowly moves, sinking and spreading, actually in some cases getting north of the Equator.?
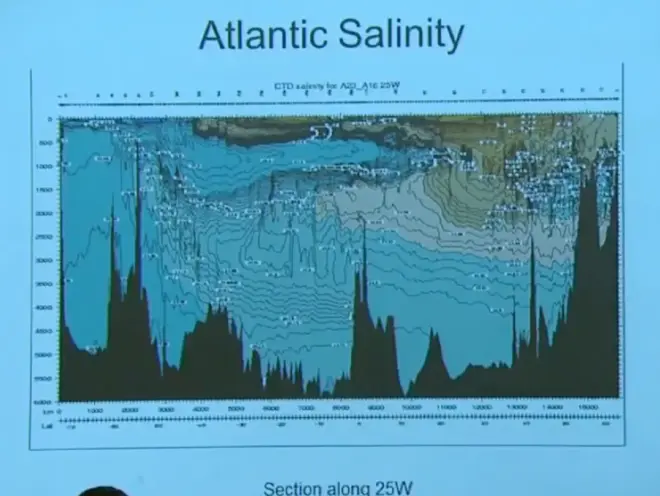
There is a layer of warm water floating right on the top in the tropical and equatorial regions. And there are some other water masses up in here that will be a little bit easier to identify when we look at the salinity field. So let me look at the salinity field here. Atlantic salinity, and 34.7, 34.9, and so on.
The Antarctic Bottom Water you can maybe see it there, but it's not as easily seen in the temperature field.?There's a tongue. Apparently, a water mass is being formed here in the Antarctic Ocean--so sorry, in the southern Ocean. Not close to the shores of Antarctica, but in the Southern Ocean. It sinks and then it spreads northwards as a tongue, again, reaching the Equator. Actually going a little bit north of the Equator. That's called the Antarctic Intermediate Water, AAIW.
There's also a water mass here. It's formed in the North Atlantic. It sinks and it spreads southward getting south of the Equator. That's the?NADW, North Atlantic Deep Water.
At the surface of the ocean where the atmosphere and the ocean touch, the atmosphere is imprinting a certain temperature, salinity characteristic to the water. That determines the water's density. That water will then sink down to its Appropriate density level and spread out. That was a case for the Antarctic Bottom Water, the Antarctic Intermediate Water, and the north Atlantic Deep Water.
Notice, their roots all go back to the surface of the ocean, because that's where they can get their properties. They get the temperature from the heat fluxes, they get their salinity from the fresh water fluxes, and then they sink and they spread out and they're found thousands of kilometers away from where they were formed, and moving very slowly there under the direction of these currents.
Oxygen doesn't play any role in how these water masses move, but they provide a good tracer. Here's dissolved oxygen, and you find the lowest values here. And notice this curious structure. Right at the ocean surface, of course, you find the highest values of oxygen. Well, the oxygen is being taken in from the atmosphere, mixed down a couple of hundred meters, and then following that water mass--here it is following the north Atlantic Deep Water, here it is following the Antarctic Intermediate Water right there.
But surprisingly, the lowest oxygen is in the tropics, just below the--not touching the atmosphere, but just below it. So there's not a very good communication or mixing between the surface of the ocean and this water or it wouldn't have that depleted oxygen. The reason why there is not strong communication there is because it's very stable. There's a thermocline there, just like an inversion in the atmosphere, prevents vertical mixing. So you get this strongly depleted oxygen water here, so close to its oxygen source, but yet cut off by this stable inversion preventing vertical mixing.?
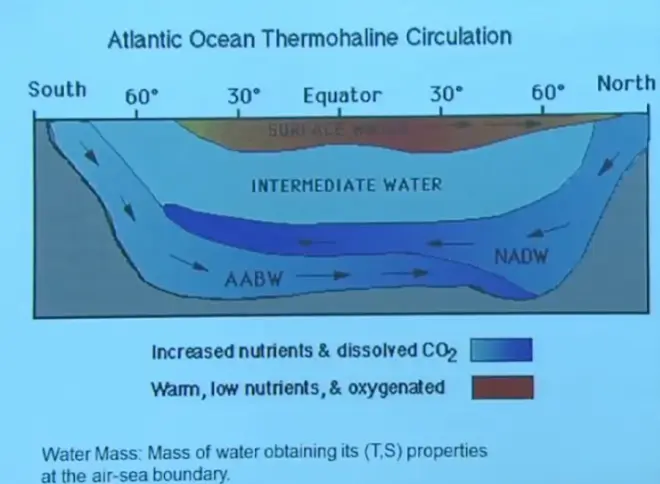
So the cartoon then of the Atlantic Ocean, the same north-south section?south to north, looks like this. You've got this warm surface water heated by the Sun kind of floating, it's quite shallow. You've got the Antarctic Intermediate Water coming in here, you've got the North Atlantic Deep Water, and then you've got the Antarctic Bottom Water. Eventually they lose their characteristics. They mix in with their environments, but for at least hundreds, maybe thousands of kilometers, during their transport, they retain enough of their property that we can identify them by where their source region was.
So this is the concept of the water mass. In oceanography we have this concept of the water mass. It's a mass of water obtaining its temperature, salinity properties at the air-sea boundary, and then sinking and moving slowly, and for years retaining that property until eventually it mixes in with its environment. And these motions are driven by these slow thermohaline-driven currents.
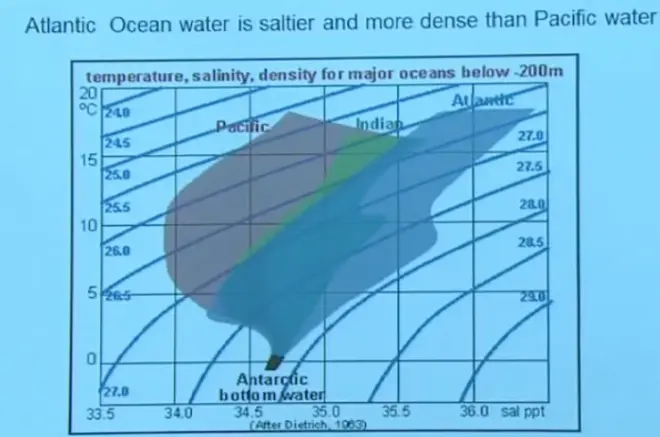
Now, I wanted to show you a famous thermohaline current called the conveyor belt circulation. I wanted to remind you that the Atlantic Ocean is slightly saltier than the Pacific, and slightly cooler than the Pacific, mostly just saltier. But as a result, the Atlantic Ocean--look at the density numbers--the Atlantic Ocean water is on average slightly denser than the Pacific Ocean.
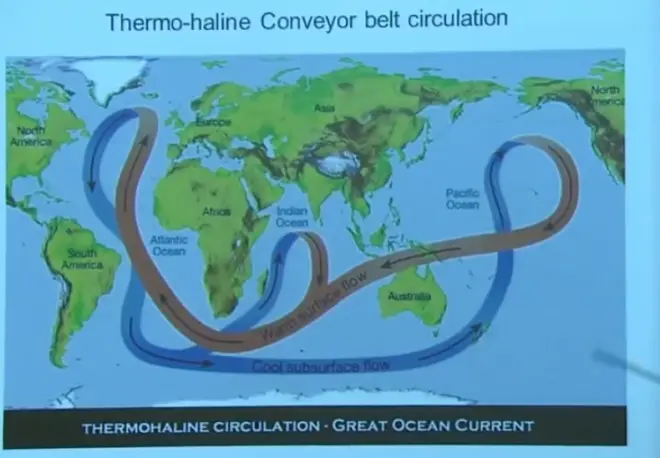
So imagine you've got these two oceans,?they're separated by North and South America, but they have different densities. If there's any leak between the two of them, that's going to try to equilibrate by setting up a circulation between them, and that exactly is what we think hAppens to give this large scale conveyor belt circulation. Notice that in the Pacific Ocean, the water is less dense. It seems to rise and then flow into the Atlantic. The Atlantic Ocean being somewhat denser, this water sinks, and then flows on the bottom of the ocean back into the Pacific. So there's kind of an overturning circulation.
It has to go through a very circuitous route because they're not directly connected. They can't make their way across this barrier or across this barrier. But they do share the Southern Ocean in common. So they can communicate and close this circulation by running the currents down through the southern Ocean. That's the conveyor belt circulation. Another example of a slow thermohaline circulation.
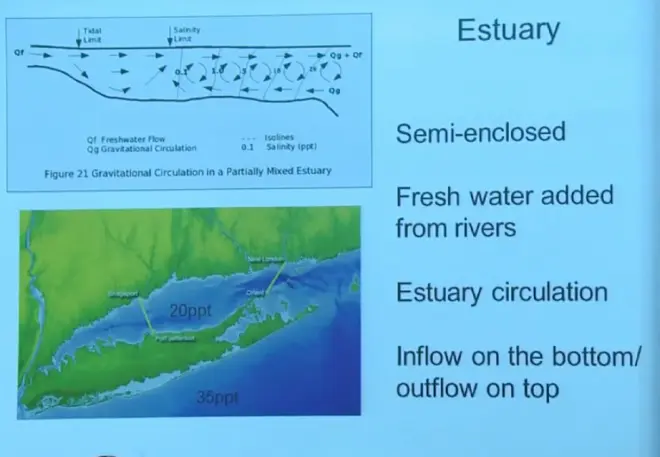
A third example is the estuary circulation. An estuary is defined as a semi-enclosed body of water with some connection to the ocean, and with fresh water inputs. Long Island Sound would be a good example of that. There are fresh water inputs--the Connecticut River, the Quinnipiac River that we studied, the Housatonic River. And there is a connection to the ocean that goes out through the race here so that you can mix ocean water in and out.
What we find is that while the ocean salinity is typically 35 parts per thousand, the salinity in Long Island Sound's only about 20 parts per thousand. I think in your field trip you found 18, but generally that's pretty close to this. So what's hAppening is it's a place where mixing occurs between fresh water coming off the land and ocean water mixing in from the ocean.
So salty water is denser. Fresher water is less dense. So what hAppens is that the denser, fully salt ocean water slides in along the bottom, has fresh water added to it, making it less dense so it rises, and then it floats out on the top. So right through here there's going to be a two-layer circulation. It's illustrated up here with the fresh water being added, and that slightly reduced salinity water flowing out at the top, and the full ocean water flowing in at the bottom.
So you get a two-layer circulation right at the entrance region to an estuary, driven by this salinity difference. That would be called a thermohaline circulation. If I turned off these rivers in some magical way, and let the mixing continue, after a few months, this would come up to 35 parts per thousand. It's the fresh water inputs that's keeping this lower than the 35. And it's that two-layer circulation that's providing the mixing between the estuary and the open ocean.
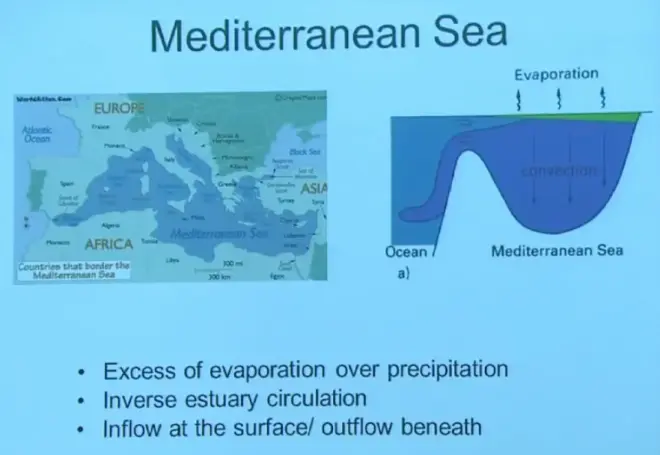
The Mediterranean Sea has one of these, but it works just in the opposite direction. Remember, the Mediterranean Sea is, especially in summertime, a very dry climate. It doesn't rain there, and there's an excess of evaporation over precipitation. Even when you include the rivers that flow into it, there's an excess of evaporation over precipitation. So it becomes saltier than the ocean itself.
And there is a connection. It's the Straits of Gibraltar. That little narrow connection between Spain and Morocco that allows some exchange to occur. Just remember now, in this case, the Mediterranean water, while it's fairly warm, the salt outweighs that. It's a denser water mass.
So here's a cross section through the Straits of Gibraltar, and here's the Mediterranean Sea in the ocean. So that dense, salty water flows out on the bottom, because it's denser, and the ocean water at 35 parts per thousand flows in on the top. A two-layer circulation driven by the salt difference. Just remember, it's opposite in a sense to the estuary that I showed you just before this.
Wind Driven Currents [00:48:03]
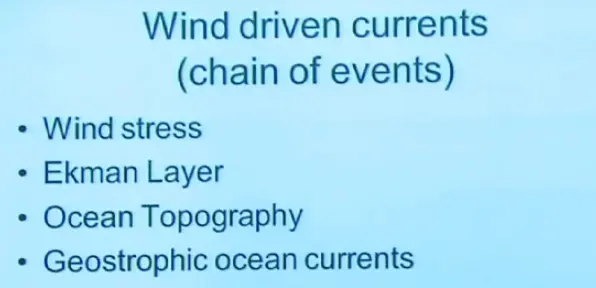
Now, we've got to get to the wind driven currents. We won't get very far on it today, but I wanted to alert you to the complexity of this subject. We've got to think of a chain of events that occurs as to how the wind generates the major ocean currents. And there are four bullets to this. The wind stress acts on the ocean as the frictional stress. That generates an Ekman layer, which moves water off at right angles to the wind stress.
That Ekman layer air flow then piles up water in certain parts of the world ocean, giving a little bit of elevation variation. We call that ocean topography. It's not large, it's only a few centimeters or tens of centimeters, but it's very important. And then that ocean topography, through the hydrostatic law, sets up horizontal pressure gradients in the ocean. If the water's heaped up here and a little lower here, you're going to have higher pressure under the heaped up water, lower pressure under the lower water.
So you're going to have a horizontal pressure gradient. If you have a horizontal pressure gradient, I think you know what's going to hAppen. You're going to set up a geostrophic current. A few hours later, you're going to have a geostrophically balanced current, and that's going to be an ocean current this time.
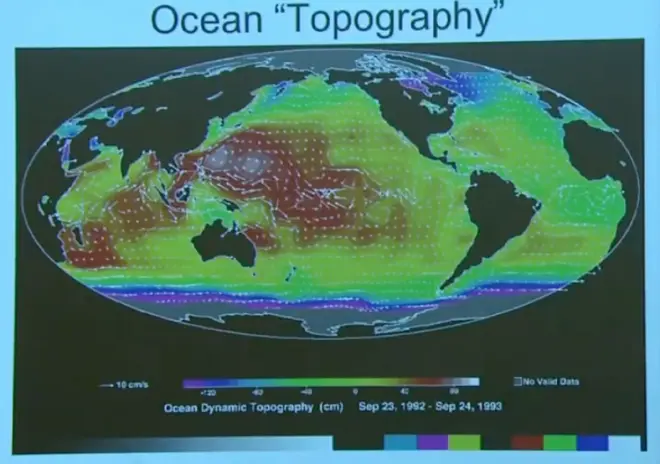
And for years and years, the theoretical oceanographers knew that that little variation in sea level had to be there. But finally about 15 years ago--well, more than that now--we were able to measure this for the first time by flying a satellite in orbit and having a laser point down from the satellite, bounce it off the ocean surface, time how long it takes to get that signal down and back up to the satellite. We were able to measure ocean height for the first time within a few centimeters of accuracy.
Then for the first time, we were able to actually make a map of this tiny little elevation in the Earth's surface. And here it is. It's called Ocean Dynamic Topography. It's given in units of centimeters. And for example, when you see red here, the water is piled up about that much. So you wouldn't ever notice this if you were sailing across the ocean. Remember, the ocean's five kilometers deep. What does 40 centimeters mean? But this is relative to the geoid, relative to a constant level surface on the ocean. And it's that piling up then that gives rise to a pressure gradient that then causes the major ocean currents in the ocean.