
【自用筆記】 AP Statistics Overview - Section 4.1
課本: The Practice of Statistics for the AP Exam (Fifth Edition)
4.1 Samples and Surveys
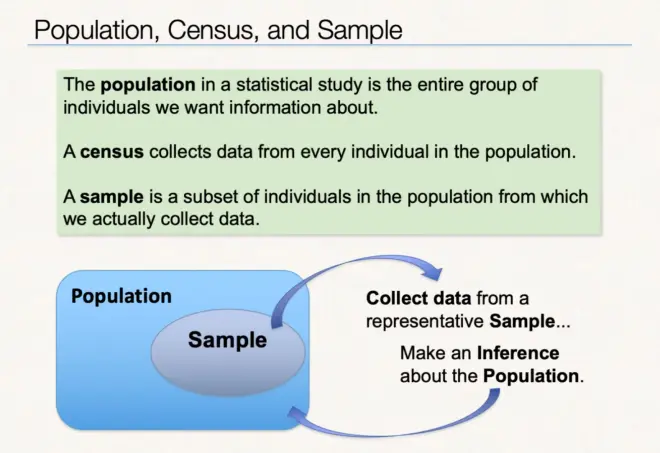
Population - the group of people you wanna conduct
e.g.: Understanding of mango tree in pacific area - mango trees would be the population
Census - ~sensor collect data from each individual
Sample - those individuals which we do really got some info from census
Inference - explanation for the population we estimated
Example on P210.
Exercises
4.1 The group of all the local businesses is the population. Those 73 businesses which returned the questionnaire are the sample of the population.
4.2 Population: all the artifacts. Sample: Those 2% of the artifacts that the project director had chosen.
The Idea of a Sample Survey
Choosing a Sample
Step 1: Define the population we want to describe e.g.: all the students in BICC
Step 2: Say exactly what we want to measure e.g.: ?how long to do / how often to do homework
A “sample survey” is a study that uses an organized plan to choose a sample that represents some specific population
Step 3: Decide how to choose a sample from the population e.g.: experiment / observations / etc.
Don’t do (Unrepresentative Data)
Choosing individuals from the population who are easy to reach results in a convenience sample (will show bias).
And also don’t choose voluntary response samples (consists of people who choose themselves by responding to a general invitation; those people have strong opinions and they are most likely to respond).
P212 AP Exam Tip
If you’re asked to describe how the design of a study leads to bias, you’re ?expected to do two things:
(1) Identify a problem with the design
(2) Explain how this ?problem would lead to an underestimate or overestimate.
P213 Check Your?Understanding
The inspector did not choose the oranges randomly (convenience sample)
The audiences who don’t want to change the HQ location would not pay for a call to vote (voluntary sample; keyword: continue)
Random Sampling
Random sampling involves using a chance process to determine which members ?of a population are included in the sample.
Simple Random Sample (SRS)
A simple random sample (SRS) of size n is chosen in such a way that every group ?of n individuals in the population has an equal chance to be selected as the sample.
Choosing an SRS With Technology
Step 1: Label. Give each individual in the population a distinct numerical label from 1 to N. ?
e.g.: 1000 mango trees - label from 0001, 0002, 0003... to 1000.
Step 2: Randomize. Use a random number generator to obtain n different integers from 1 to N.
(Check chapter 6 to see how to choose N properly)
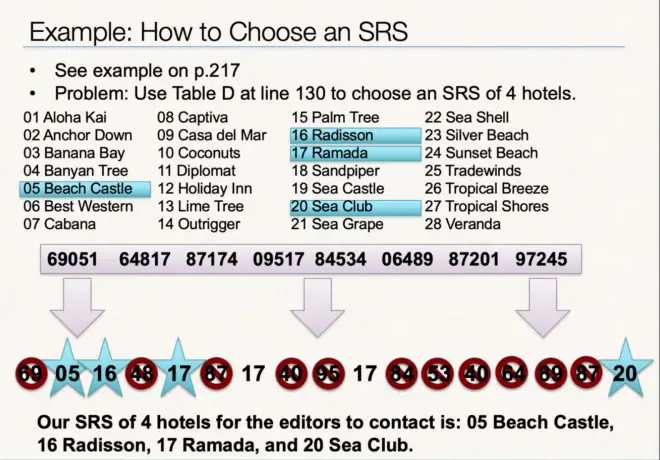
How to Choose an SRS Using Table D
Step 1: Label.
Give each member of the population a numerical label with ?the same number of digits. Use as few digits as possible.
Step 2: Randomize.
Read consecutive groups of digits of the appropriate ?length from left to right across a line in Table D.
Ignore any group of digits ?that wasn’t used as a label or that duplicates a label already in the sample. ?
Stop when you have chosen n different labels. Your sample contains the individuals whose labels you find.
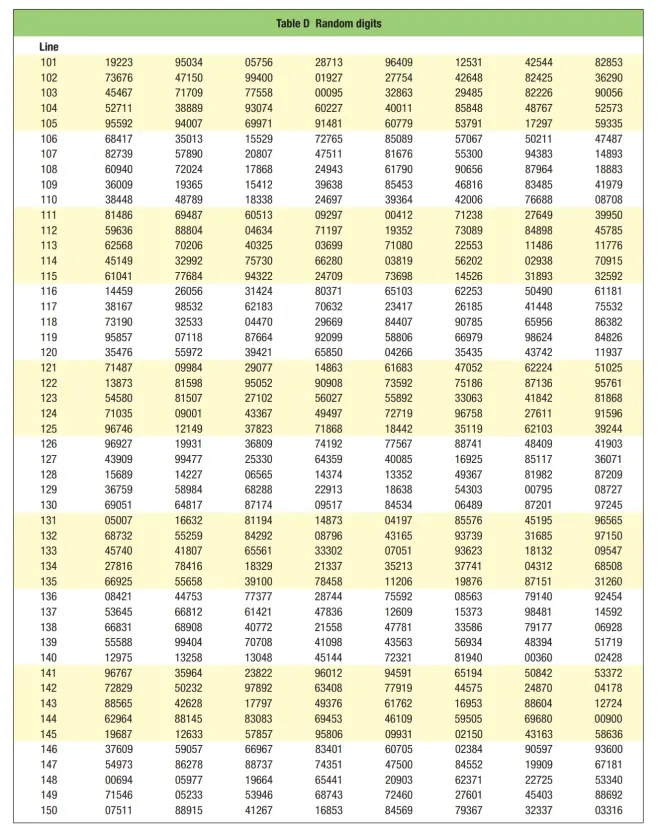
Table D on T-5 appendix
Stratified Random Sample and Strata
To get a stratified random sample, start by classifying the population into groups of similar individuals, called strata. Then choose a separate SRS in each stratum ?and combine these SRSs to form the sample
Strata - a group of individuals that are similar.
Cluster Sample and Clusters
To get a cluster sample, start by classifying the population into groups of individuals that are located near each other, called clusters. Then choose an SRS of the clusters. All individuals in the chosen clusters are included in the sample.
Simple Random Sample - completely randomized
Stratified Random Sample - average randomizing in different kind of groups
Cluster Sample - label in groups, randomizing the group number, then select the group randomed itself (more efficient than SRS)
Example on P221.
P223 Check Your Understanding
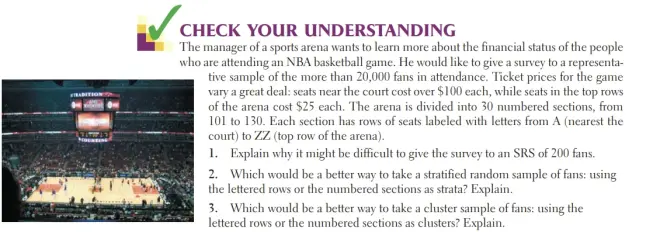
For example because the arena is quite big, it is really difficult to pick 200 fans all over the arena totally random.
For a stratified random sample, using the numbered sections is better, since different rows has different ticket prices. We can classified the audiences by rows easily. In the same row the audiences are similar.
For a cluster sample, using the numbered sections is better. Each section contains seats from row A to row ZZ, which could represent the population well.
Inference for Sampling
The purpose of a sample is to give us information about a larger population.
The process of drawing conclusions about a population on the basis of sample data is called inference.
Why should we rely on random sampling?
To avoid bias in selecting samples from the list of available individuals.
The laws of probability allow trustworthy inference about the population.
Example on P223.
Sample Surveys: What Can Go Wrong?
Most sample surveys are affected by errors in addition to sampling variability.
Good sampling technique includes the art of reducing all sources of error.
Undercoverage occurs when some members of the population cannot be chosen in a sample.
Nonresponse occurs when an individual chosen for the sample can’t be contacted or refuses to participate.
A systematic pattern of incorrect responses in a sample survey leads to response bias.
The wording of questions is the most important influence on the answers given to a sample survey.
(End)
