26. Isotope Evidence for Climate Change
GG 140: The Atmosphere, the Ocean, and Environmental Change

Lecture 26.?Isotope Evidence for Climate Change

https://oyc.yale.edu/geology-and-geophysics/gg-140/lecture-26

Stable Isotopes of Water [00:00:00]
Today I'm going to finish up a two-lecture description of paleoclimatology and the ice ages, and then starting on Friday, I'll go into the subject of global warming.?
Hydrogen has a nucleus with one proton, therefore it has a single positive charge and typically has one electron with a negative charge going around it.?There are two famous isotopes of hydrogen. One is deuterium, and one is tritium.?Deuterium?has one proton and one neutron. This has a mass of one. This has a mass of two. But notice it still has just one positive charge, so it has just one electron going around it.?So chemically, the two are identical. They have the same electronic orbitals, and they'll bond and so on in just the way—in the same way that the other one does.
The other one I want to think about is oxygen. Oxygen typically has eight protons and eight neutrons. Because of eight protons, it has eight positive charges. It'll have eight electrons going around it. And that will determine its chemical properties. And this would be called Oxygen 16, because that mass adds up to 16 atomic mass units.
The other one we're interested in has 8 protons and 10 neutrons, adding up to a mass of 18. Still has eight protons, therefore has eight electrons. Same chemical properties, but a different mass, and this one is called oxygen 18. And by convention, that mass number is put to the upper left of the letter symbol for that element. So oxygen 16 and oxygen 18.
Now, we're interested in water. So the question is what water molecules can we make from these isotopes? And by far the most common would be normal H2O, which would have oxygen 16 plus two hydrogens coming off it. Water vapor has a dihedral shape. It's not a linear molecule. The hydrogens droop off at an angle. That's by far the most common, because this is much more common than that by a factor of 1,000 or so. And this is much more common than that by a factor of 1,000 or so.
So if you just randomly put these molecules--these atoms together to form molecules, almost everything is going to be like this, but there are going to be some that have this structure where you replace one of the hydrogens with a deuterium. Notice that this has a mass of 18, because it's 16 plus 1 plus 1. This is going to have a mass of 19, because it's 16 plus 2 plus 1.
This would be called the normal, and these would be the heavier ones. And we keep track of the ratio. For example, if you're comparing these in a sample, you would measure the D/H ratio. Or if you're comparing these two, you would take the ratio of oxygen 18 to oxygen 16. And the higher this is, you would say--the common terminology is that the water is heavy if it has a large deuterium to hydrogen ratio, or it's heavy if it has a large oxygen 18 to oxygen 16 ratio, or light if it's got a lower than usual ratio of deuterium. So I'm going to be using these terms heavy and light in a relative fashion to describe whether these ratios are typical for ocean water or larger or smaller than that. So I hope you've Googled or gone back to your high school or college chemistry book and reviewed this.
Now, some isotopes are so-called radiogenic isotopes. They are temporary isotopes that can be formed by nuclear reaction and then decay automatically with some half life. Those are called unstable, or radiogenic, isotopes. And maybe those are the isotopes you've heard about before, but I'm not talking about those. These are called stable isotopes, because they remain. They don't have any natural decay. They just exist in these different mass forms, and they persist over millions and billions of years. So these are the stable isotopes--in this case, I would call these the stable isotopes of water.
So now for our purposes, it's very important to know that the heavier isotopes?have a slightly lower vapor pressure. Because they're heavier, they move a little more slowly in the liquid, which means they evaporate more slowly than this, but they would condense more readily than normal water. Therefore, when you do get a phase change, when you get vapor going to liquid or you get liquid going to vapor, there will be a fractionation.?A fractionation means a process where you change the ratios of these two things.
Isotope Delta Notation [00:09:48]
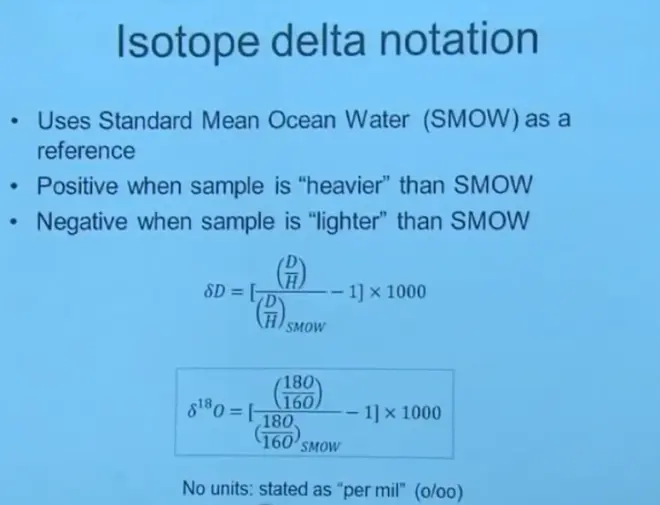
Now, the way we keep track of these ratios is with the so-called called delta notation. We have to define a reference ratio of D/H. And that's standard mean ocean water. It's basically a sample of several places around the ocean. They collect, mix them all together, and store large volumes of it in laboratories, and use that as a reference every time they're doing an isotope ratio measurement. So that’s called--the abbreviation for that is SMOW, standard mean ocean water.
Then you measure the D/H ratio in the sample of interest, divide it by the D/H ratio in your reference liquid, SMOW, subtract 1, multiply by 1,000, and that is so-called the delta D value. If it's deuterium, it's delta D. If you do the same thing with oxygen, it's the delta O18?value. And that's what we'll be tracking.
So notice the way this is subtracted. So if you had a sample that had a larger ratio of D/H than the reference, that would end up being a positive number. And we would call that--we'd say the sample is heavier than SMOW. If the D/H ratio is less than the standard, then the number is going to turn out to be negative, and we're going to say that sample is lighter than SMOW. This quantity is usually stated as per mill or written not with a percent sign but with a percent sign with two zeros on the bottom.
Isotopic Fractionation [00:11:41]
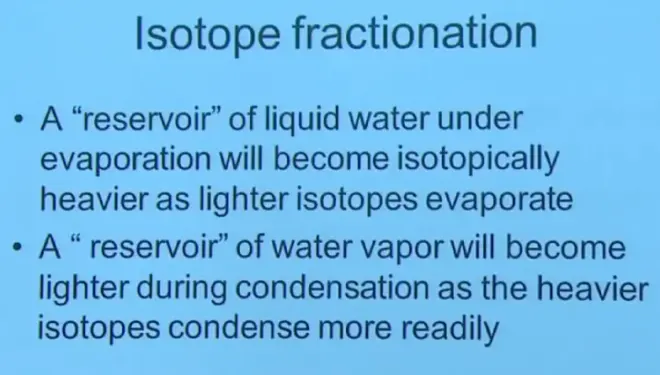
So?a reservoir of liquid water under evaporation will become isotopically heavier because the lighter isotopes will evaporate more readily. A reservoir of water vapor--imagine some water vapor in this room, and we're condensing out some of it--that's going to be isotopically lighter, because the heavier isotopes are condensing out and leaving preferentially.
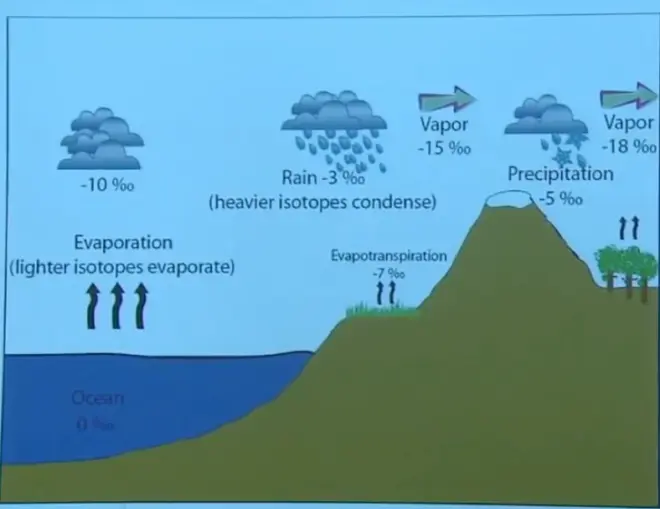
Now, in the real world, if you start with an ocean value of zero, the delta D value, or the delta O18?value would be zero, which is likely, right, because ocean is our modern reference for isotope ratio. So typically, the delta values for modern ocean are going to be very close to zero. When you evaporate, the isotopes—the lighter isotopes evaporate preferentially, and so the vapor you have in the atmosphere is typically going to be lighter than the ocean. It will have a negative delta value.
And then as you condense water out, the rain is going to be heavier than the vapor. So if the vapor is minus 10, the rain is going to be heavier than that. Let's say minus 3. The remaining vapor after you've removed some of the liquid is going to be lighter still, because you've removed some of the heavier isotopes. Then if you rain again from that lighter vapor, the precipitation is going to be heavier than that vapor but lighter than the rain that fell out before. And the vapor remaining is going to be even lighter, because you've removed heavier isotopes of the vapor that you started with. So this is the progressive fractionation process.
Water Isotopes in Ice Cores [00:18:08]
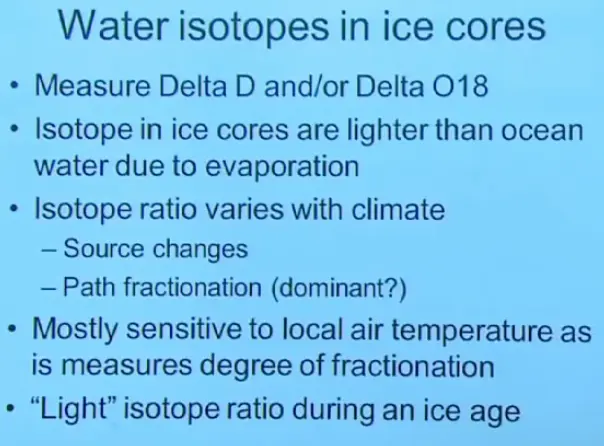
So when you go to Antarctica or Greenland and dig down and pull out an ice core, you’re going to look at things as a function of depth.?But from that ice core, you're going to shave off ice from different depths and determine the delta D and the delta O18?values as a function of depth.
Generally, the isotopes in the ice cores are lighter than the ocean. Because for example, the precipitation falling on this mountaintop is lighter than the ocean. It goes back to this initial evaporation. The vapor became so much lighter as it evaporated that that lightness still remains, is even amplified by precipitation that's occurred between the ocean and the location where you're getting your sample. So the isotopes in the ice core will be lighter than the ocean, but they're not going to be constant. They're going to vary with climate.
And in the literature, there are two ideas that have been put forward to understand why those isotopes would vary with climate. One is that under a different climate situation, the source of the water vapor might change. And the other is that the fractionation that takes place in the atmosphere between the ocean and your sampling location might change.?Source changes or changes in that progressive fractionation in the atmosphere.
It's believed now by almost every author that this is the dominant one.?So in the next bullet, I said it's mostly sensitive to local air temperature, as that measures the degree of fractionation, which means that you get a light isotope signature during ice age.
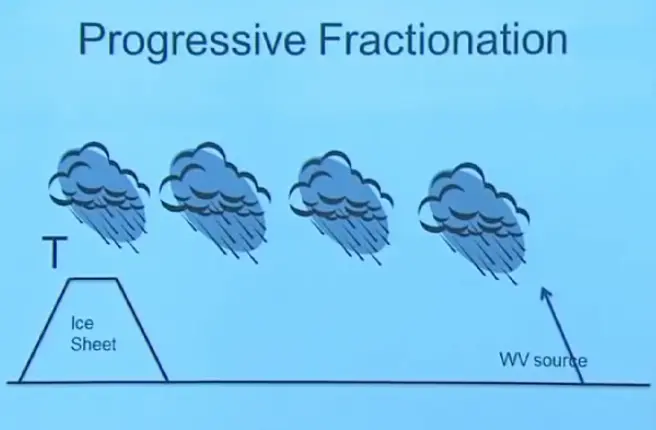
So you have some water vapor source. We're going to presume for the moment this is constant, giving you the same isotope ratios in the evaporating vapor. Then as this air parcel moves along and encounters different clouds and different storm events, you're going to gradually precipitate out that water. Every time you do so, you're going to be precipitating the heavier vapor, leaving the lighter behind. So the next precipitation is going to be lighter than the first and still lighter and still lighter.
And so the isotope ratio in this final falling snow that's going to fall on your ice sheet is going to depend on how much you've cooled the air between the source and the sample area, because the more you've cooled it, the more water vapor you have removed. Remember, when you drop the temperature, you decrease the amount of vapor that can be held. And therefore, if you cool the air a lot, you've had to remove more and more of the water vapor. And when you do that, you get an isotope which gets lighter and lighter in proportion to how much you've cooled the air going from source to record location.
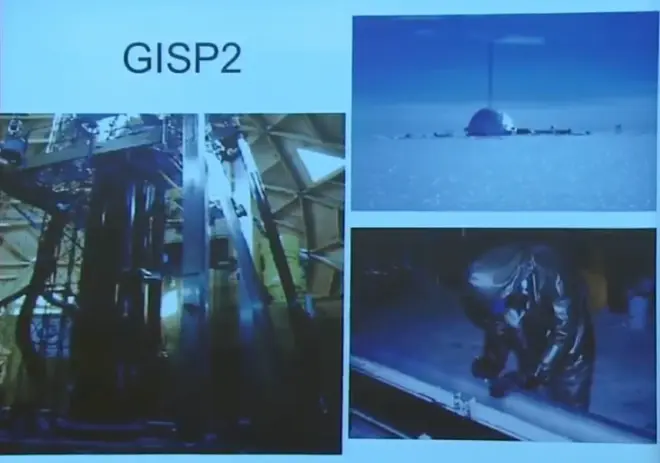
So we're going to look at some Greenland cores. There have been a number of them done. Camp Century, a couple of GRIPs, GISPs, GISP 2, and Dye 3. Here's a snowfall map of Greenland. Most of the accumulation is down here in the southeast, but you get some accumulation everywhere. And what we're going to do is to put a drilling rig up on the ice cap, up on the ice sheet and drill down.
Here's a scientist marking an ice core. And ice core is about that big around. And it can be many hundreds of meters, even a kilometer or so deep. And of course, they pull it out in sections. They pull out a section break it, lay it down, put it in a storage shed, then drill out another ice core and so on. So they end up with these things stored in sections, and then they can do analysis as a function of depth. And if they have some kind of a dating tool, they can determine what age that ice is at, of course older and older as you go deeper down into the ice core.
We've done this on Antarctica as well. All these dots are places where there have been ice cores. We're going to be talking about the Vostok Core, which is one of the deepest cores. This one was done by the Russians some years ago.
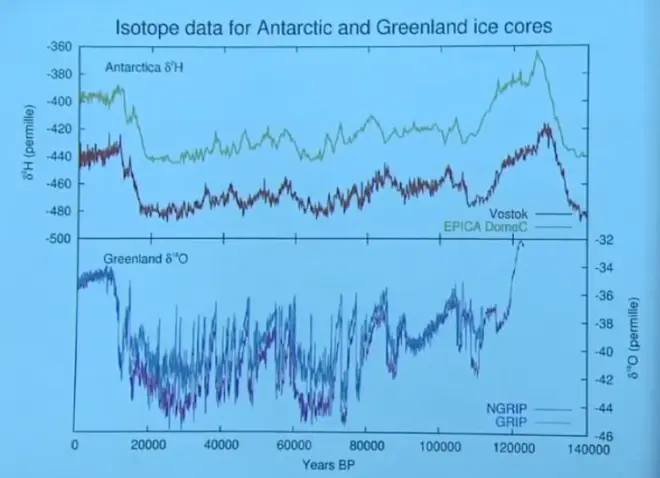
So here's a record then with years before present on the x-axis. And in the upper panel are cores from Antarctica. And they are represented as delta D values. Here they've written it as delta 2H. Remember 2H is what we're calling deuterium. So this is the same as our delta D value.
And then down in the lower panel is the delta O18?for a Greenland ice core--in fact two of them, NGRIP and GRIP. And you can use either isotope. It doesn't really matter which pair you're using. You get a similar signal for climate change. There isn't a great deal of difference between using delta D and delta O18?for these purposes.
But the numbers are different. For example, for delta D, the delta values are much larger. They're minus 460, 440, 420, whereas for oxygen, which fractionates less strongly, you get somewhat smaller. Notice that they're all negative though, which means that all these ice samples are isotopically lighter than the ocean. We expected that for two reasons. One is the water that evaporated from the ocean was lighter than the ocean water itself because of fractionation. And then this path fractionation as the water moved from source to Antarctica or source to Greenland, you've made it even lighter by raining out a fraction of the water on the way to this final record location.
Well, this gives us a rather nice time record. This is the modern era. This is today, if you like and it looks like we have somewhat heavier isotopes than normal during the last 12,000, 15,000, 20,000 years ago. And of course, this is the Holocene Period, the last interglacial.
Prior to that, the isotope ratios were more negative, which means lighter.?We would interpret that as having more water removed between source and sample location, which means a lower temperature at the sample location. So the conventional wisdom is to interpret this as giving you a temperature record near the place where the record is kept, near the ice sheet.
So colder. Staying cold for about 100,000 years. Then a brief interglacial, and then back into another long ice age with cold conditions at least at the location of the ice sheet. May be cold other places as well, but what we're measuring here, we think, is the temperature of the air over the ice sheet where those snowflakes are being formed.
This is Antarctica. And notice that both cores done independently show a very similar record. Even more surprising is that when you go to the northern hemisphere in Greenland, you get a record that, again, is fairly similar with interglacials, glacial periods, the Holocene. So this seems, although it's a local measurement, it seems to be global in character. And this is a characteristic then of global climate, even though it's a local temperature record.
One more thing that's even more astounding, you can take those same ice cores and find tiny bubbles in them. As the snow fell and more snow fell on top, and you finally compacted it into ice, there are little bubbles that trap samples of the ancient atmosphere. You can stick a probe into those ice bubbles and do a carbon dioxide concentration analysis to find out what the carbon dioxide concentration was in those ancient atmospheres.
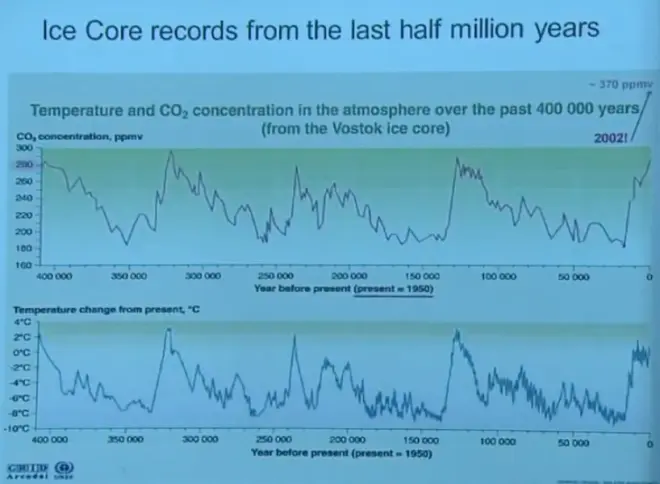
So here I've plotted up from the Vostok Core alone, a record that goes--the time axis is switched here.?I've shown you data back to 400,000 years ago. Here's the isotope record converted to a temperature. Isotope record converted to an equivalent temperature. And then in the top panel is the carbon dioxide concentration taken from the same location along the ice core.
Here's the modern day. At the top of the ice core, you had about 280 parts per million by volume, which is about the value we think is the pre-industrial carbon dioxide value for the Earth's atmosphere. Then back in the end of the last ice age, the last glacial maximum is here. You had much lower carbon dioxide concentrations, even below 200 parts per thousand. It stayed low, and others have mirrored the temperatures quite remarkably.
Carbon dioxide concentration and temperature are very similar. They have a very similar record, at least over this period we call the Pleistocene, with the ice ages coming and going and coming and going. We'll talk a lot about this coming up in the global warming, but at a very minimum, this reinforces our idea of the importance of CO2?and climate. When you had high CO2, you had warmer climates. When you had low CO2, you had colder climates, perfectly fitting with our idea of the greenhouse effect and CO2?being a greenhouse gas.
Now there's also some argument though about cause and effect, which comes first, which leads and lags. We'll get into that a little bit next week. But for the time being, I would take this at face value and just say that it reinforces the connection between CO2?in the atmosphere and global temperature.
Terrestrial and Deep Sea Sediments [00:31:14]
Now I want to talk about other kinds of sediments. Rocks that seem to have a layered structure. Most of the time, when you see such rock patterns, you're looking at some kind of evidence of ancient climate change. One kind of climate allowed sediments in a lake to look like this. Because you see lots of sedimentary layered rocks like that. It's not so easy to figure out what exactly this means in terms of climate. But it's a start to be able to see such stratification on land and just imagine in a vague way, this may be evidence of changing climates in the ancient world.
So we're going to do something similar to this but in the ocean, where the ocean sediments have had a rather constant sedimentation rate. And therefore, we can do a little easier job of interpreting if we can get a sample of that. So the way we do that is to do deep ocean drilling. You take a ship that has a drilling rig on it. And you lower that drill bit down to the ocean floor and then start pushing into the soft sediments. And then after a while as you go deeper and deeper, you're drilling into rather solid rock, but it's all representing deep ocean sediments.
Oxygen Isotopes in Ocean Sediment Cores [00:33:44]
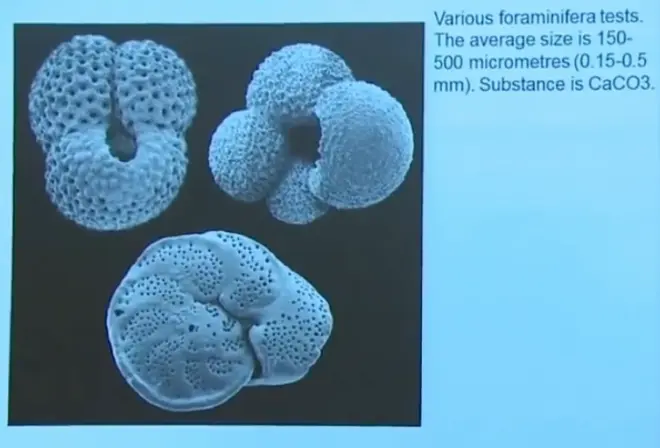
And primarily these deep sea sediments are comprised of calcium carbonate. They've got other things in them, but calcium carbonate, CaCO3, it has oxygen in it. Besides calcium and carbon, it has oxygen in it. And they're mostly the remains of shells produced by microorganisms, phytoplankton mostly, in the ocean. And when the organism makes its shell, it gets its oxygen from the oxygen in water. So there stored in this calcium carbonate is a record of the isotope ratio of oxygen--O18?to O16?in ocean water, because the organism got its oxygen from seawater in order to make that shell.
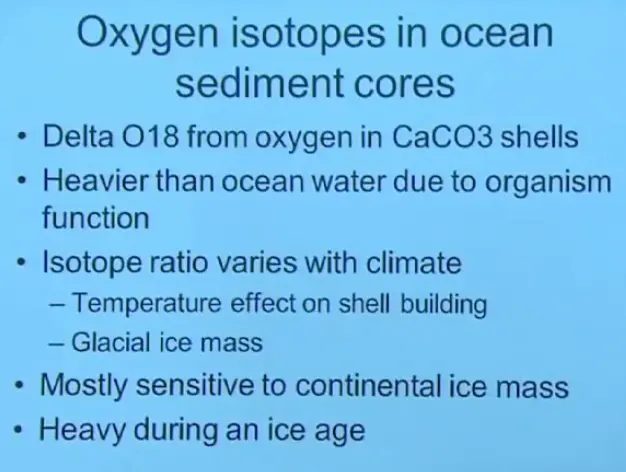
So what we've done is take samples of the oxygen from the calcium carbonate. We expect that sample of oxygen is going to be slightly heavier isotopically than the ocean water, because when the organism makes its shell, it slightly prefers the heavier isotope. In addition to that, though, we expect it to change with climate either because the temperature effect on how the organism makes its shell might be coming through, or the isotope ratio in the water itself might be dominating the signal.
The first papers on this thought it was this. Now there's an almost universal agreement in the scientific literature that when you get oxygen 18 data from ice cores, you're mostly getting a measure of the oxygen in the ocean water, and that's telling you something about the glacial ice mass, how much water has been stored up on land in the glaciers.
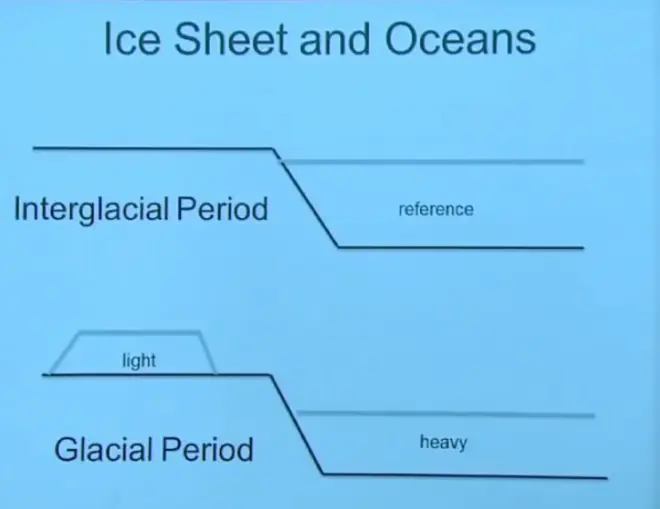
Let me explain that with a cartoon. In a period like today, an interglacial period, the oceans are full of water. This is our reference state today by the way for O18. During a glacial period, you have lowered sea level by evaporating water from the ocean and not returning it. You're evaporating water from the ocean. You're raining it out over land, and it's running right back into the oceans in rivers. No net change. The hydrologic cycle is just running in steady state. The oceans are staying at the same level.
However, during a glacial period, you've evaporated some of that water and not returned it. You stored it as a large sheet on the continents. We know that that water is lighter isotopically than the ocean, so you’ve stored light water on the continents, which means that the oceans are now isotopically heavier than they were before.
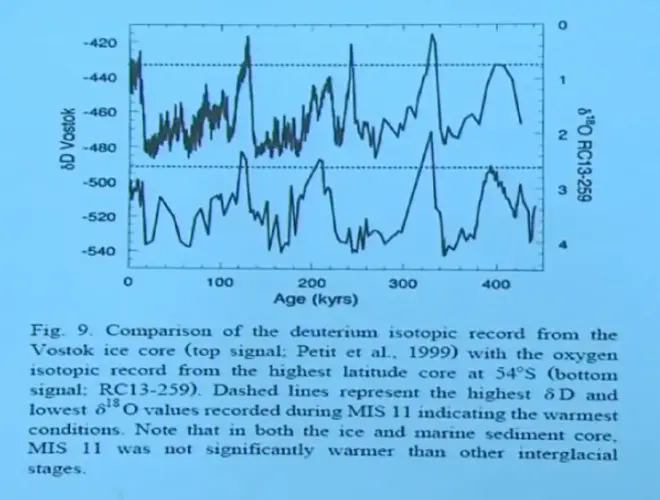
So here's the comparison. Vostok delta D is plotted in the upper panel, and the scale is on the left. This deep sea sediment core, which is represented as O18--delta O18, is plotted on the right. And it's the lower panel. And the time scales are matched up. So we can go back 400,000 years into the past for both of these records.
And notice how they line up. But the signals are opposite. So during an ice age, the delta D is more negative, whereas the deep sea sediment core is more positive, because you've stored light water on land, made the oceans heavier, and that signal is coming through.
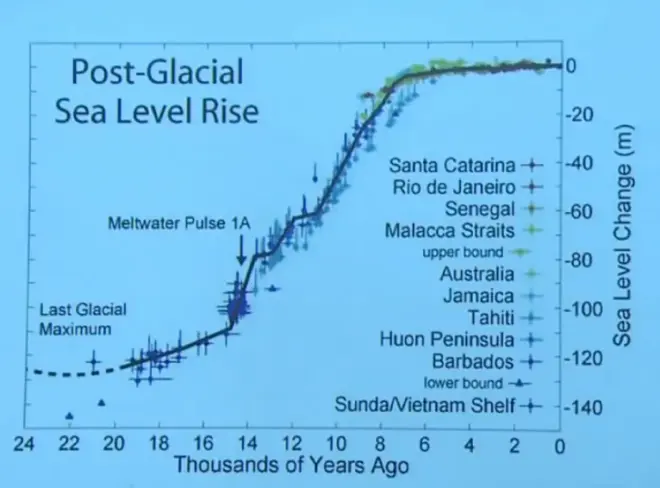
if you put all that ice up on land, you will have lowered sea level. And so here is a record from physical measurements, going around various places, understanding from the nature of the shoreline where sea level was at various times in the past. This is thousands of years ago. And at the last glacial maximum, which is here, sea level was about 120 meters below where it is today. And you find that same thing no matter where you measure.
Remember, sea level tends to be level. It's in the very name. And so when you drop sea level, you drop it the same everywhere in the ocean. And therefore you should get the same record no matter where you do that analysis. And then as we came out of the last ice age, we came up to the present sea level rise.
So this is from physical measurement, not from isotope measurements, but it agrees conceptually with that deep sea sediment core analysis, which I argued is a measure of how much water is stored on the land in large ice sheets, especially the Laurentide ice sheet and the Fennoscandian ice sheet.
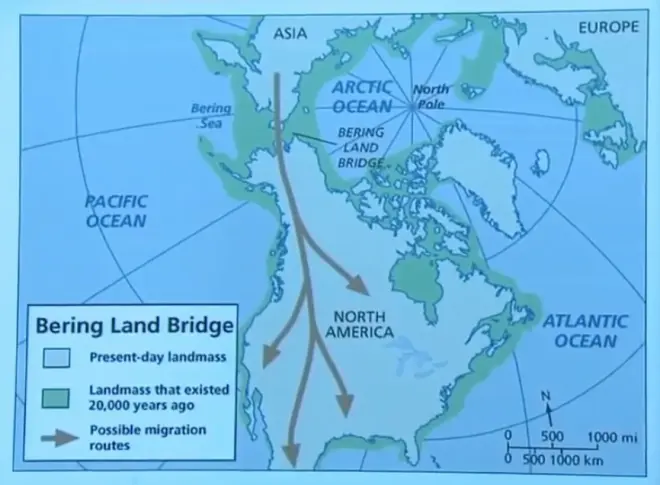
So if you made a map of the Earth during the last glacial maximum, land would be somewhat larger. Of course we know this is mostly continental shelf. You don't have to lower the ocean very much in order to expand it out a bit—expand the continents out, because there's some shallow submerged land today. But that's typically where the coastline would have been 15,000 to 20,000 years ago. And the point I want to make here is that the gap between Asia and North America was actually bridged at that time because of a lowered sea level. It's believed then that this was the moment when humans could first migrate to North America.
Milankovitch Theory of Ice Ages [00:44:08]
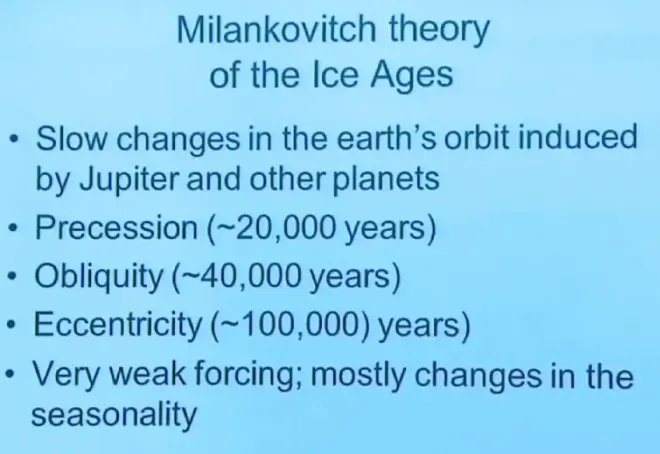
I want?to talk about Milankovitch theory. What has caused this periodic coming and going of the ice sheets during the Pleistocene? It's not a solved problem. I don't want to present this to you as known fact, but there is considerable evidence that slow changes in the Earth's orbit induced by Jupiter and other planets probably were what caused or at least in some way paced the coming and going of the ice ages during the Pleistocene.
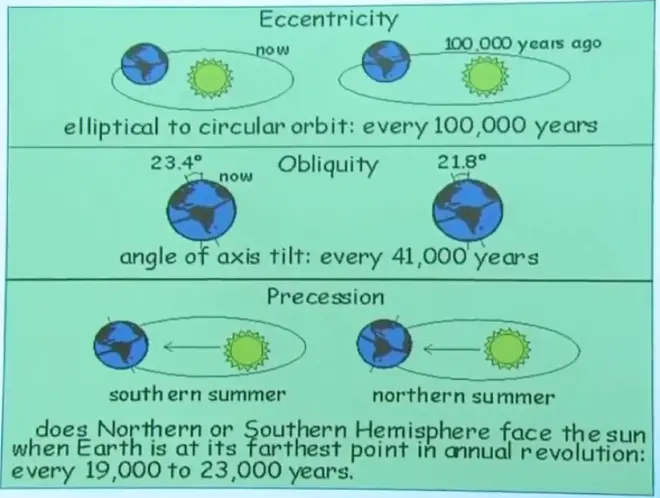
And the three changes in the orbital parameters that are discussed—that are understood in this regard are the precession--that is a slow rotation of the orientation of the Earth's tilt. Second is the obliquity, which is the magnitude of the Earth's tilt. And the third is the eccentricity of the Earth's orbit. You know that the Earth's orbit around the sun is not exactly circular. It has a little bit of eccentricity to it. And the amount of that eccentricity has been changing slowly with time.
The precession goes through a full cycle--all the way around and back--in about 20,000 years. The obliquity, this little changing of the tilt, goes through a full cycle approximately every 40,000 years. And the eccentricity, the changing of the ellipticity of this orbit, goes through a cycle of about every 100,000 years.
What these things mostly do, if you think about it, is that they change the way seasonality works. Remember, the obliquity, the tilt of the Earth's axis, controls seasonality on Earth. And the precession, the way that this orientation of the tilt lines up with the long axis of the orbit, controls the strength of the seasons also because of the way the tilt and the perihelion combine. So these two things are mostly changing the seasonality, but apparently that is enough to push us into and out of an ice age.