
30. Climate Sensitivity and Human Population
GG 140: The Atmosphere, the Ocean, and Environmental Change

Lecture 30.?Climate Sensitivity and Human Population

https://oyc.yale.edu/geology-and-geophysics/gg-140/lecture-30

Future Climate Research [00:02:03]
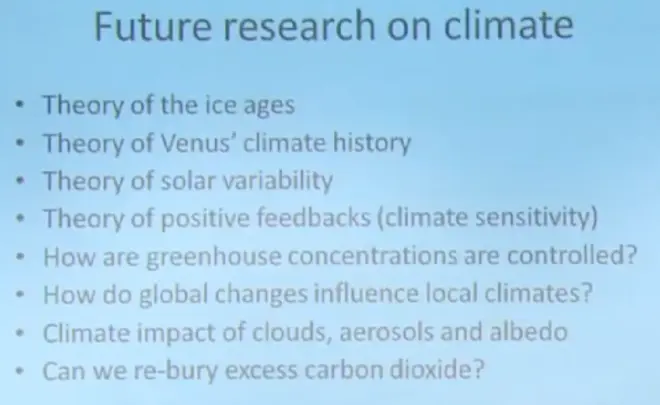
While climate research is quite a mature area now, there are some areas within it that require further thought. For example, we're still missing a complete theory of the ice ages. We think that maybe this Milankovitch forcing has played a role. But that Milankovitch forcing is very weak actually. The obliquity change, the tilt of the earth's axis, is only a couple of degrees one way or the other.
The procession theory, which changes the orientation of the tilt of the earth's axis, changes the way the seasons work, but oppositely in the two hemispheres. So if you're looking globally, that influence cancels right out completely. So you have to make up some argument about why one hemisphere is more important than the other. So we're missing a complete theory there. We're also missing a theory of Venus' climate history. How it got from being an earth-like planet to something that's much, much hotter. And that's important, as I mentioned, because there's some worry that the earth's atmosphere might follow a similar path.
Theory of solar variability, now we know that the sun has gotten hotter over the millennia, over the age of the earth. And we know that there's a sunspot cycle, an 11 year and a 22 year cycle, on the number of sun spots on the surface of the Sun. And we think that that may have had a very minor influence on the amount of radiation reaching the earth. But that theory is not well fleshed out. There are some statistical relationships that have been proposed. But the physical mechanisms for this make almost no sense. And so we need to further understand why the sun might vary in its strength and what influence that would have on the earth.
The theory of positive feedback,?the idea that there are these processes on earth that will tend to amplify climate change. The ones that we've talked about already have been ice albedo feedback. More snow in a colder climate makes the albedo larger, reflects more radiation, cools the earth more, and that might spiral on itself.?There's the water vapor feedback. A warmer climate would put more water vapor in the atmosphere certainly. Water vapor is an important greenhouse gas that would warm the climate further.
And then one that's been talked about more recently, seems to be going on with the last 100 years or so, is carbon dioxide feedback, where a warmer climate is beginning to allow carbon trapped in permafrost to decay and be added to the atmosphere. Also ocean water, when you heat it, it can hold less carbon dioxide dissolved in water. So that CO2?is going to be added. So this acts on a slower time scale perhaps, but there's some worry that there's a carbon dioxide feedback that may be starting to happen.
That one has to do--that last one has to do with this next one, how greenhouse concentrations are controlled. We don't have a complete understanding of the carbon cycle. Or how some of the other greenhouse gases, like methane, ozone, oxides of nitrogen--there's not a complete understanding of how they are controlled in the earth's atmosphere.
The last IPPC report, the one that you've been looking at, the AR4, is full of apologies for how little they can say about regional climates. The problem is that these global climate models roughly agree in their predictions of how the global temperature will change. But they disagree, to a large extent, about how the climates of different continents and different sub regions within continents will change. So this is a big area of research.?
Climate Sensitivity [00:07:13]
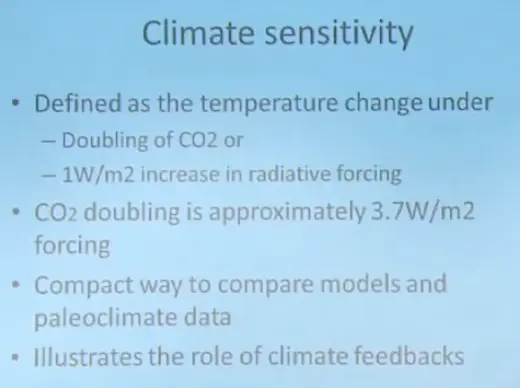
So the last thing I want to talk about in this set of lectures is something called climate sensitivity. And it's basically an attempt to simplify and quantify how earth will respond, how the earth's climate will respond, to changes in radiative forcing.?
There are two different common definitions for climate sensitivity. So I need you to be aware of both of these. One definition is, how much would the earth's climate warm if there was a doubling of CO2? That's a commonly used definition for climate sensitivity. The other one is, how much would the earth warm if you increased the radiation hitting the surface of the earth by one watt per square meter?
It illustrates the role of these climate feedbacks. So it turns out that these climate sensitivity values, almost no matter how you compute them, are larger than you would expect if you left off the feedbacks. And so by that increase in sensitivity you can show what role these climate feedbacks are having.?
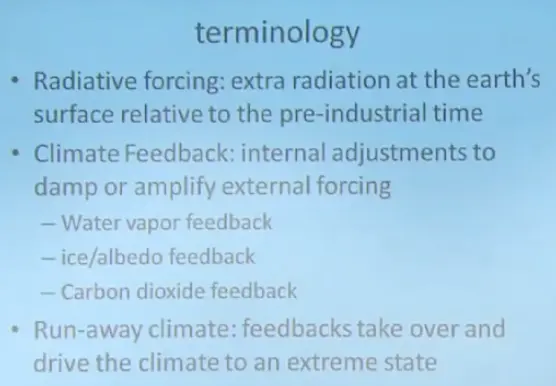
Radiative forcing, extra radiation at the earth's surface relative to preindustrial time. That's the way radiative forcing is defined in the global warming debate.?These are the primary feedbacks we're talking about. And occasionally you'll find a discussion of a runaway climate where the feedbacks, the positive feedbacks, are so strong that they would take over and drive the climate to an extreme state, like has happened on Venus. Unlikely for earth, but it's part of the conversation. There's another variable that comes in, in how you define climate sensitivity. And that has to do with, what feedbacks do you include in the calculation?
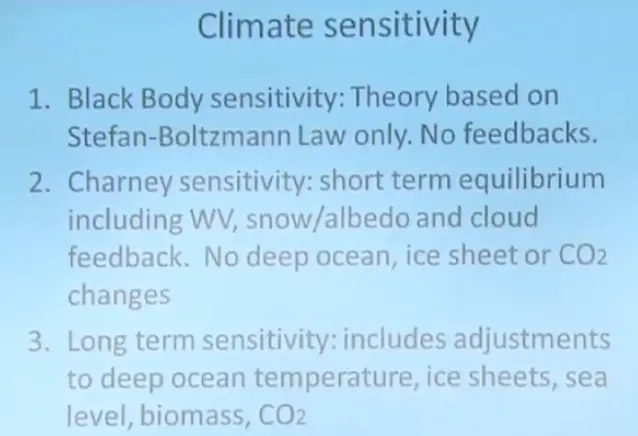
So I'm going to define something called the Black Body sensitivity, which has no feedbacks in it. It's based on the Stefan-Boltzmann law only, which you remember, from earlier in the course, is the fact that the radiation emitted from an object's surface goes like the fourth power of the temperature. That was the Stefan-Boltzmann law.
There's something called the Charney sensitivity. Charney was a scientist who chaired the first investigative panel on global warming. And he tried to base their final report on a particular definition of climate sensitivity that included some short-term feedbacks, but excluded some of the longer term ones. For example, he included water vapor feedbacks, snow/albedo feedback, and cloud feedback. But he excluded any feedback connected with the oceans, the ice sheets, or carbon dioxide changes. And that's become known, in the literature, as Charney sensitivity.
It's probably valid on periods of time of, say, well 20 to 50 years, something like that. When you go to longer terms, however, maybe 100, 200, 300 years, you have to realize that other slower adjustments in the climate system are going to be happening, such as changes to deep ocean temperature, changes in the ice sheets. Sea level will be rising. Biomass on the continents may be changing. And the carbon dioxide may be responding to changes in the ocean and the land surface, the land biomass. So that would be called long-term sensitivity.
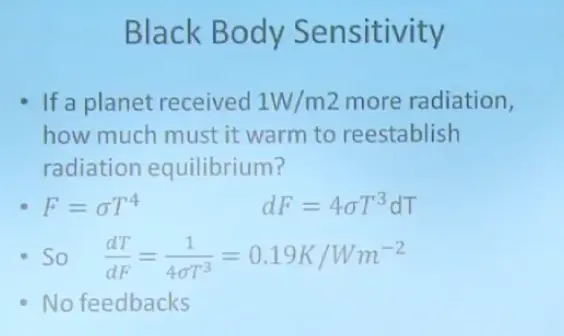
Makes you realize this subject is not dirt simple. I mean, it's got some complexity to it, depending on the time frame that you're talking about and the feedbacks that you're allowing in the calculation. So here's the easy one, Black Body sensitivity. If I've got an object, like a planet, receiving a certain amount of radiation from the sun, you know that it'll increase its temperature, or adjust its temperature, so that it radiates to space just as much as it's receiving from the sun. So it'll adjust it's own temperature to come into that kind of radiative equilibrium. Well then, if I were to increase the amount received from the sun by 1 watt per square meter, how much must the temperature rise in order to establish a new equilibrium?
So there's the Stefan-Boltzmann law. If I take the derivative of F with respect to temperature, I get 4 times sigma T to the third times the change in temperature. And if I rearrange, bring the dF under and that down under here, I get that formula. The change in temperature for each change in flux is given by 1 over 4 sigma T to the third (dT/dF=1/4σT3).
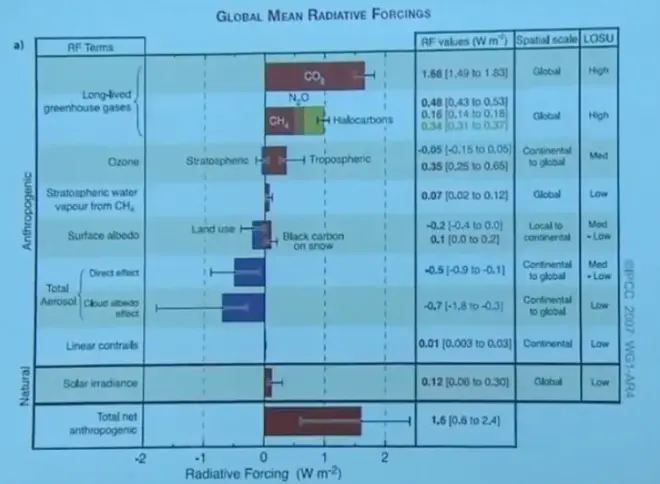
Now, if you look at the IPCC report that?summarizes the radiative forcing, using the definition that I gave a moment ago. This is since the beginning of the industrial revolution. It shows how much the radiation reaching the surface of the earth has changed and for what reason. Carbon dioxide is the biggest reason. That increase in carbon dioxide, we've seen, caused about 1.7 watts per square meter added greenhouse forcing at the surface of the earth.
However, methane, N2O, and the halocarbons have added something too. Tropospheric ozone has added more. And then on the negative side,?aerosols, mostly sulfate aerosols from coal burning, has had a negative effect. Well when you add all these together, these roughly cancel these. And you get a value that's about what CO2?would have been by itself.
That doesn't mean that CO2?is alone in importance. The others are important too. But generally these cancel those and you get a value of about 1 and 1/2 meters per second for the radiative forcing. And so if you then just use the Black Body sensitivity for that, that would give you about 0.3 degree Kelvin warming.
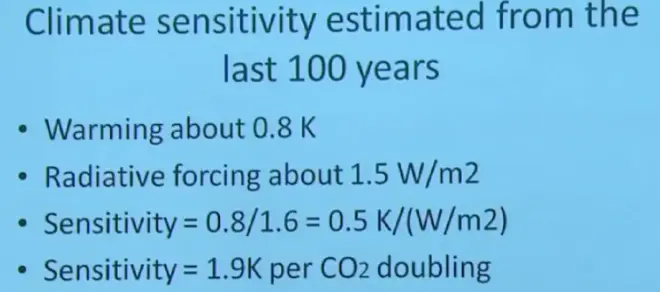
And we know, in fact, from our data, that the warming of our planet since the industrial revolution began is about 0.8. So it's quite a bit larger than this value. We can formalize that. So let's try to compute radiative forcing based on the data that we have.
Over the last 100 years we've had about 0.8 degree warming. From the last slide, we've got about 1.5 watts per square meter radiative forcing. So if I divide one by the other, I get a sensitivity based on the radiation definition of 0.5 Kelvin. That then is about 2 and 1/2 times the sensitivity there. So the sensitivity that we're seeing in our planet is about 2 and 1/2 times what we compute from a simple Black Body forcing law. This then, is evidence that the feedbacks are working, the positive feedbacks are working. You could re-formula that as a warming per CO2?doubling. And you get about 2 degrees Kelvin for every CO2?doubling.
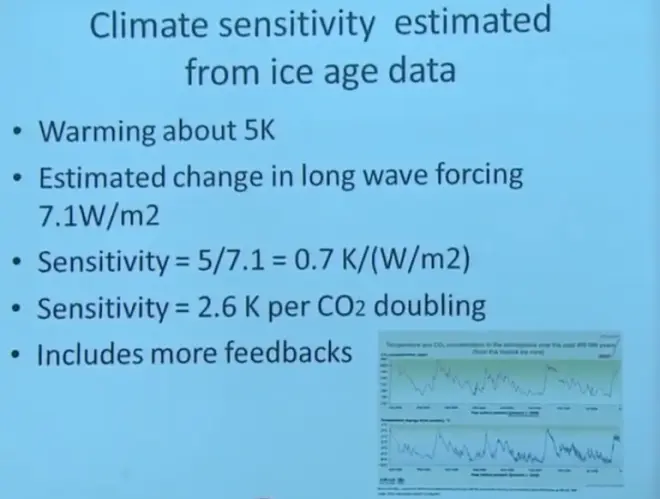
I want to do this one other way. I know I'm beating this to death, but--you remember this plot, from the Pleistocene, the advance and retreat of the glaciers over the last 400,000 years. Well, here we have a temperature signature on the bottom and a CO2?signature on the top. We can convert the CO2?signature to a radiative forcing. And here's how that argument goes. So that's a warming of about 5 degrees between glacial and interglacial times. We estimate a change in the longwave forcing of about 7 watts per square meter. Divide one by the other, I get about 0.7 degrees Kelvin per watt per square meter.
Now that's slightly larger than the one we had on the last slide from the last 100 years. And most people believe that that number is larger than the--what did we have for that--0.5, 0.7, because you get these extra long-term feedbacks coming in. So there's still a lot of argument in the literature about that. But the general interpretation is that when you go to this longer time scale of a couple hundred thousand years, you get some longer—some other positive feedbacks that make the climate even more sensitive to radiative forcing.?
Yeah, so I'll just wrap that up by saying, as expected, our climate is about 3 times more sensitive to radiative forcing than Black Body would suggest, due to positive feedbacks like water vapor feedback and snow/albedo feedback. And when you go to longer time scales, it becomes even slightly more sensitive due to, possibly, some other feedbacks.
Population [00:22:31]
Because population is a driver in global warming, I wanted to just to spend the rest of the period--I'm not an expert in demography or population studies. But there's a few things that are quite obvious, that even I can understand. And I wanted to lay those out for you. Because it's intimately connected with all these environmental issues, including the air pollution which we'll be studying next time and on Friday.
So these are the terms you're going to have to know. The fertility rate is the number of children that a woman would bear in her lifetime. The growth rate of a population would be the rate of change of the population as a fraction of the existing population. In other words, a relative rate. Not a number of people per year, but like a percent per year, or something like that.
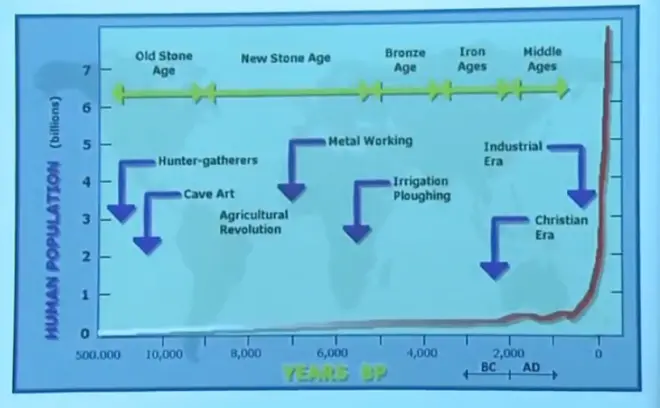
Population versus time, going back 50,000 years, human population rose very slowly over most of the period of time when humans were evolving, because, well, life is difficult. The death rate was high due to disease, due to accidents, due to all kinds of things. And it isn't really until you got in the very recent period of time where you began to get this rapid, very rapid, increase in human population.
Probably the biggest change in the rate of growth had to do with the changes in medicine, I would say the germ theory of disease and inoculations. Both of which are rather recent. We're talking about the 19th, in some cases the early part of the 20th century. 1920, 1930, 1940 when mass inoculations began to be used. Anyway it's a very curious curve, so slow and so flat for so long, and then rising so rapidly now just in the last 100 years or so.
That is partly controlled by the fertility rate. And here's a diagram from Wiki about that. What you have for each country--and this is by country--is a fertility rate from 0—or from 1 to 7. So the United States would have a value somewhere around 2. Remember this is the number of births per woman in her life. And a lot of other countries have that medium gray color, which puts you around 2. The Soviet Union, especially Ukraine, is even less than that, however.
And most of Africa and the Middle East are dramatically higher, generally in the range 4, 5, 6. That doesn't necessarily mean that their population is increasing rapidly, although that's true also. But the fertility rate is one of the components that goes in to determining the rate of population growth. Everybody understand this definition of fertility rate?
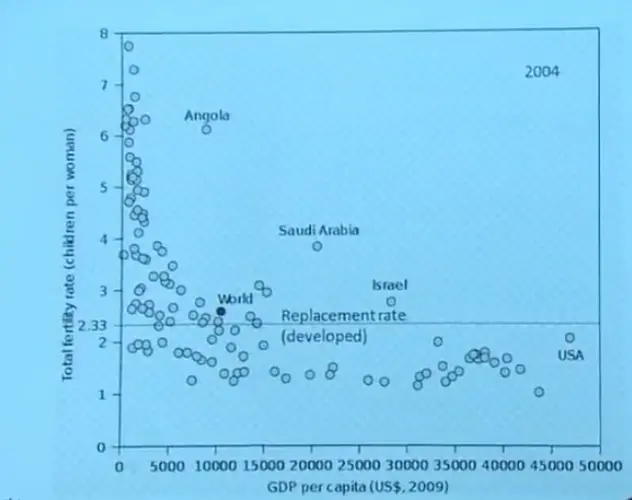
Here's the fertility rate plotted versus GDP, the Gross Domestic Product, that makes it pretty clear there's a relationship between how much money people have, their standard of living, and the fertility rate. USA is here. Generally, for the developed world the fertility rate is 2 or less. Whereas for the underdeveloped world the fertility rate can be very much higher.
And this magic value here, of 2.3, is the replacement rate. You have to have a fertility rate of about 2.3 in order to maintain a steady population. There are a few outliers that have to do with the special cultural conditions of those countries. Stop me if there are questions on this.
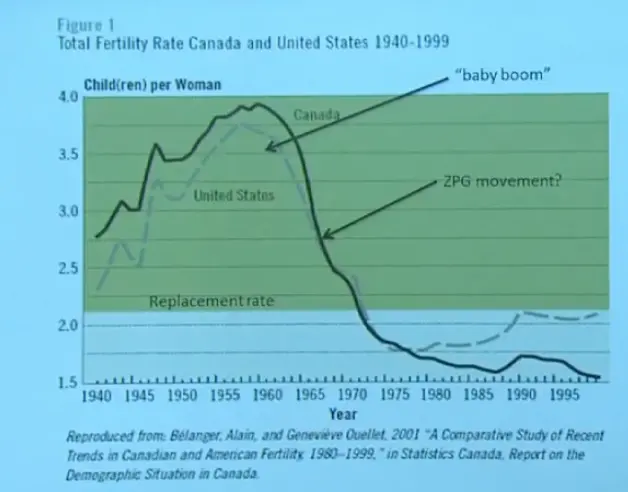
So let's look at the fertility rate for the United States and Canada since 1940. There was a big bulge in fertility rate, reaching 3.7 for the USA around 1955. And that is really what's responsible for what's called the Baby Boom in the United States. And I guess you are the children of the Baby Boom generation or something approximate to that.
And then immediately after that came a movement called ZPG, Zero Population Growth. Maybe that movement caused this drop, or maybe it was just changes in background cultural or economic conditions. But there was a dramatic drop in the fertility rate in the United States from 3.7 down to less than 2. And now it's come up a little bit for the United States to just about the replacement rate.
Canada is roughly similar. The details may be a little different, they haven't jumped up at the end. But they followed roughly the same curve. Any questions on that? So this is a wild swing, right? This is a huge variation in just a few years in one particular country.
Europe is famous for having a low fertility rate. And here are some of the numbers. Remember the replacement rate is about 2.3. Italy has 1.3. And some of the Eastern European countries are even lower than that. France is higher. They've tried to keep their population, their fertility rate up. But they don't have it quite at replacement levels. And Spain is down at 1.3 as well. So Europe, as a whole, generally has a very low fertility rate. We saw that in the earlier map as well, here, as opposed to some other developing parts of the world.
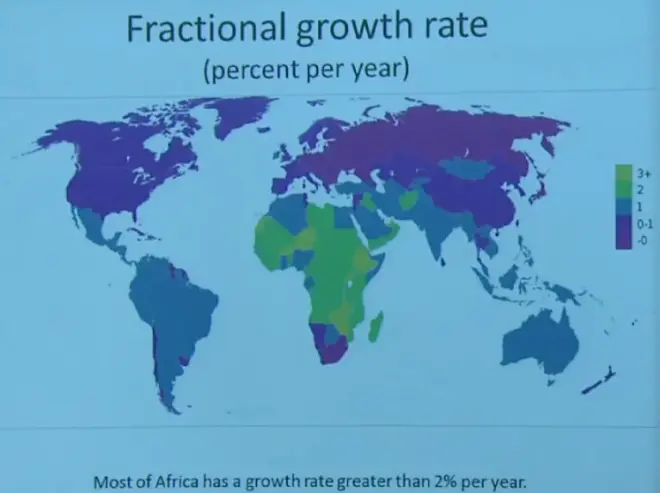
Now we’ll move to this fractional growth rate then. So, of course, this is now a combination of birth rate and mortality rate. How many children are born every year? How many people die every year? You have to know both of those to then get the total fractional growth rate of the population.
And there again, these colors follow the same trend. As the Soviet Union has the lowest growth rate, well below 1—well below 0. They're losing population. And all the other countries are gaining population, but at a rate ranging from 3% per year to just a small fraction of a percent per year. So that's the total fractional growth rate.
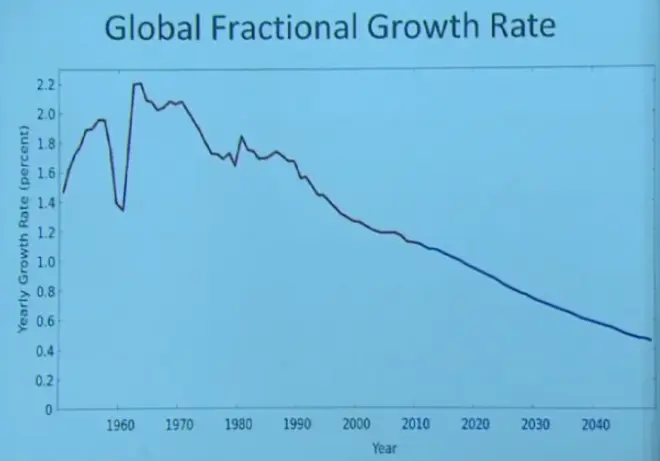
So globally then, this is what the fractional growth rate has been doing and is projected to do. But these projections are quite uncertain. I wouldn't pay too much attention to the blue curve. Globally we've had, over the last couple of decades, we've had growth rates--this is not fertility rate, this is growth rate--of about 2% per year, which is quite a large growth rate.
It has been decreasing. At the present time, it's more like 1% per year. But that's still quite a large growth rate. And then it's predicted that will continue to drop as we go forward. But that will depend a lot upon the future economy, the future cultural development of the countries that have the highest populations.
Exponential Population Growth [00:34:23]
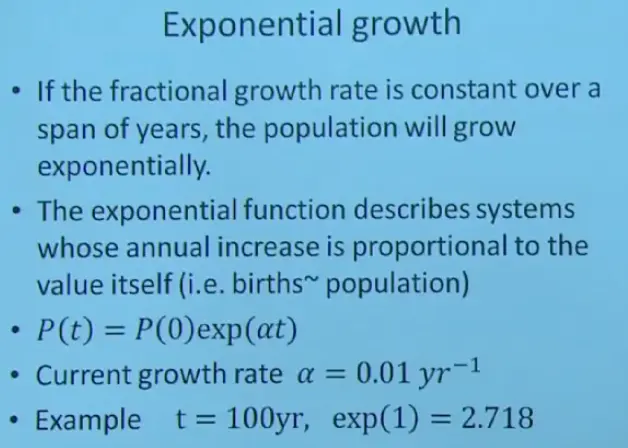
Now this concept of exponential growth, you've probably heard it. If the fractional growth rate is constant, that is, if this quantity were constant in time, over some period of time, then the population will grow exponentially.?The exponential function defines a system whose annual increase is proportional to the population itself. In other words, its rate of increase is proportional to the population that it has. That is what is meant by an exponential increase.
Now, if you're getting a fixed interest rate in your account, then it would be exponential. It'll grow at a rate that will increase as you get more and more money in the bank. So that might be an accurate representation. But remember, exponential doesn't refer to some rate of increase, it relates to the relationship between the rate of increase and the amount of the standing population that you have at any particular moment.
So in other words, births minus deaths, really, proportional to population. So we write it this way. Population, as a function of time, is given by the population at some reference time, call it 0, and then e to the plus alpha t, where alpha is the growth rate and t is the time that's elapsed since your reference time has occurred.
So if the growth rate, for example, is 1% per year--and that was a number that we have about now for planet earth--and if that were to remain constant. In other words, if this curve was level at 1% per year, then here's how you could do the calculation. After 100 years, putting in 100 years into there and 0.01 year to the minus 1 in for alpha, the units will cancel. And in this case, the product is equal to 1, in this special simple example. So it's going to be exp--e to the 1, which has a value--you can check it on your calculator--of 2.7.
So a growth rate of 0.01 over 100 years would give a growth rate factor of 2.7. So however many people you had at the beginning of the 100 year period, put that there, multiply it times 2.7, and you'll get--it's roughly a tripling, roughly a tripling of the population over 100 years if you have a growth rate of 1% per year. Remember it's compound interest. The rate increases as the population increases.?
Population Density [00:39:41]
Another issue that comes up is population density. How many people per square kilometer do you have? And this is a map of population density. Units are people per square kilometer. And there are some countries--and this is by country so this can be quite misleading, because for a given country they put a uniform color over the whole country. So it's the total population divided by the total area of the country, then painted as a uniform color over the whole country. That's quite unrealistic. But it will give us a place to start to talk about population density.
India, as a country, has a population exceeding 1,000 people per square kilometer, which is enormous. Whereas something like Australia is in the lightest shade that they have I guess, less than 10 people per square kilometer. Wide variation in that quantity. But again, this is quite misleading because it's done by country.
United States, this is per square mile. Remember, the United States unfortunately is still on an old English system of measure. So very often you'll find population densities—population per square mile instead of per square kilometer. You can do the conversion easily to go back and forth.
When you think about what the limiting resources are for living on our planet, water, food, energy, living space, even these other ones, like water and food and energy, to some extent they all depend on having enough area as well. For example, energy from hydroelectric requires a large catchment area of rain in order to get hydroelectric. Farmland, obviously food from farms requires lots of area. So just scanning this list and realizing that many of those have a relationship to population density would, I think, partly confirm Jared Diamond's idea that living space is an important part of the success of a culture.
Urbanization [00:43:29]
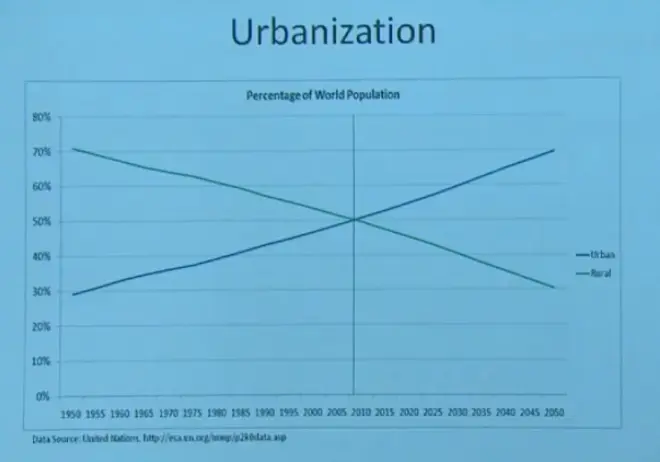
Now to correct the misimpression from those earlier country-based and state-based population densities. People don't live uniformly distributed over a country or a state. In fact, a higher and higher fraction of populations are moving to cities. They're abandoning the land and moving to cities. So this is a plot, on the x-axis 1950 into the future, 2050, the percent of the population that's living in urban versus rural areas.
Back in the 1950's, 70% was rural, 30% urban. And we've crossed that boundary, we've crossed that crossover point. And in the future, we'll have more people living clustered together in cities. That doesn't mean they don't need the land around the cities to grow the food and provide the energy and so on. But at least their living density is much larger than those country-averaged or those state-averaged values that I gave you.?And these are some of the growing megacities, where now more than half the people in the world are concentrated into these large cities.?
Demographic Transition and the Population Pyramid [00:45:46]
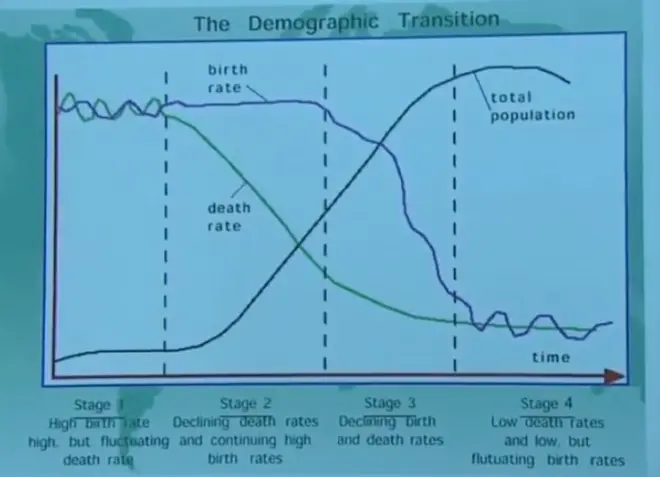
We need to wrap up. I do need to give you this. So there's something called the demographic transition. And it goes basically from a third world country converting to a first world country. What happens to its population?
In the beginning, you've got a high birth rate, a high death rate, and a small population. Standard of living begins to increase, health is improved. The first thing that happens is the death rate drops. The birth rate stays high. Because the death rate has dropped and the birth rate stays high, the population begins to increase. Then, at some point culturally, the birth rate drops as well. You end up with a lower birth rate and a lower death rate and a larger total population.
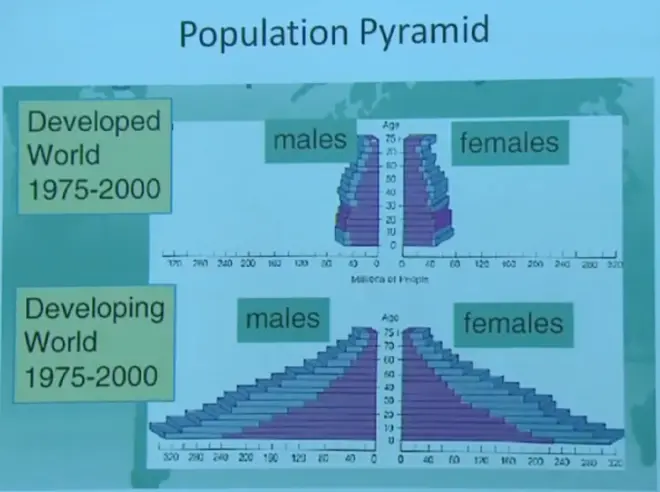
You have to know about the population pyramid. So a country that has a stable population, here's a plot of how many people you have, male and female, in different age groups. A country that has a stable population usually has a population pyramid like this.
A country that has a rapidly growing population has a pyramid like this, a lot of young people. And as they get older, of course, the overall population will increase very rapidly. Well, you can see this immediately, because if you drive into a small town in the Middle East or in Africa, the number of children that come running out of the house to see who's visiting their village tells you you've got a population curve like that.
