22. Ocean Currents and Productivity
GG 140: The Atmosphere, the Ocean, and Environmental Change

Lecture 22.?Ocean Currents and Productivity

https://oyc.yale.edu/geology-and-geophysics/gg-140/lecture-22

Ocean Currents [00:00:00]
Thermohaline would be all currents that are driven by the density differences in the ocean. Thermohaline is the name for that, because temperature and salt determine the density. And then gravity acts on those density differences to produce so-called thermohaline circulations.?Wind driven is driven by the wind stresses at the surface of the ocean. If you could magically turn off all the winds, then perhaps not at that instant, but over some days or weeks, all the wind driven currents in the oceans would cease.
Now, the thing to remember?about both of these types of currents, they're not driven locally by those forces. In other words, you could have wind blowing from west to east, and have, at that same location, wind driven currents in the opposite direction.
These large gyres are driven by the mean wind stresses, westerlies in mid-latitudes, easterlies in low latitudes. And there well may be, in fact, there are many places in the ocean where the local wind driven currents are opposite to the local winds.?They're still wind driven currents.
There was this blob of salty water--you'd expect the water in the tropics and subtropics to be salty, because there's an excess of evaporation at the surface of the ocean. But what explains this blob of salty water is actually that outflow from the Mediterranean Sea.?That salty outflow from the Mediterranean Sea then moves westward across the Atlantic Ocean, and catches us in this north-south section.?This is the Mediterranean water coming into this section from the east as an outflow from the Mediterranean.
So it flows over the sill there in the Straits of Gibraltar, flows down till it finds it's appropriate density level, where the water above it is less dense, the water below it is more dense. And then it floats horizontally as a tongue of salty water, finally reaching that section. It's part of the reason why the North Atlantic deep water is generally salty, because the Mediterranean water gets entrained into that North Atlantic deep water.
Wind Driven Currents [00:07:37]
he chain of events, as we understand it today, is that the wind stress produces a shallow transport of water in the layer that feels that wind stress directly. That's a pretty shallow layer, probably only 100 meters deep. And in that layer, the water gets pushed off to the right of the wind stress, in the Northern Hemisphere.
That Ekman layer transport piles up water. For example, in the middle of the North Atlantic gyre, there's this piling up of Ekman layer drift. And that, in turn, that slight non-uniformity in the height of the ocean surface, generates pressure gradients beneath--horizontal pressure gradients--that then generate geostrophic ocean currents. The center of the North Atlantic gyre is referred to as the Sargasso Sea. ?If you take a ship across the Atlantic, through the middle of this gyre, when you get into that region of the ocean, you begin to see floating pockets of plant material. It's mostly sargassum weed. It's floating there. And the reason why it's collected there is because of the Ekman currents pushing it there. So we had some clue that that was a region of convergence, even before we could measure that sea surface height anomaly from satellites.
If you dumped in--and now that there's more pollution in the ocean, people have dumped loads of trash into the ocean that floats, some of that is found in the Sargasso Sea as well. It's just an area where water tends to collect, and then, of course, sink eventually. But in the collecting, all the things that float remain kind of gathered there in the middle of the ocean.?We've also found these gatherings in the middle of the other ocean gyres. So there's evidence that ocean water does collect there, and the things that float are still found there. So the fact that it's called the Sargasso Sea gives another clue to this sequence of events.
So there's the winds, and there's the ocean topography, as measured from space. With units in centimeters, typically it's only a topography of about like this. The water is slightly higher there than the geoid of the earth, there's a surface you can imagine, nearly a sphere, which we consider to be the level surface. And this rises slightly above that level surface. And then, in turn, gives rise to the pressure gradients underneath that.
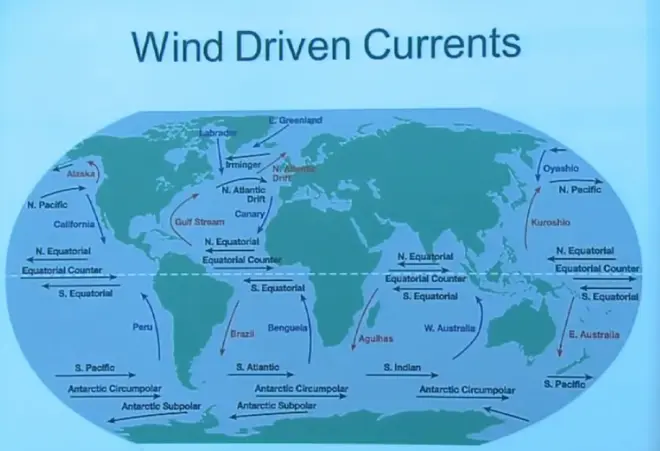
And these are the wind driven currents. The Brazil Current runs down the coast of Brazil, the Peru Current runs up the coast of Peru, the California Current, the Alaska Current, the West Australian Current, the East Australian current.?
When I say they're geostrophically driven, or geostrophically balanced, I mean they have a balance between pressure gradient force and Coriolis force. Where does wind appear then in that? If it's Coriolis force and pressure gradient force, does that mean wind is not active? No. Wind was important in setting up the pressure gradient force. So wind is still in there, even though it doesn't appear directly in that force balance.
Transport of Water in Ocean Currents [00:15:43]
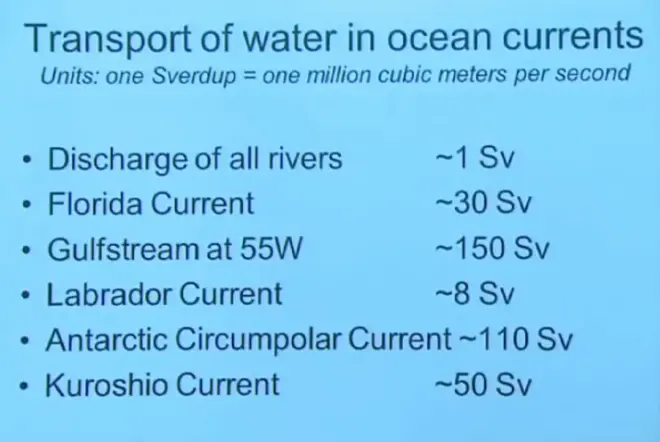
Now, we try to estimate how much water is moving in each of these currents.?For example, where the Antarctic Circumpolar Current passes through the Drake Passage, between the Antarctic peninsula and the southern tip of South America, that's a well-defined channel, if you like. And so, we can measure with ships and so on, and current meters, we can measure how much water flows between there. And that would be a local measurement of the Antarctic Circumpolar Current.?In other places,?the Gulf Stream, where do you put the outer edge? It does weaken as you go out, as I'll show you in a minute. But it's still a little bit ambiguous about where you mark the outer edge of the Gulf Stream.
And we're using the unit of Sverdrup here, which is named after a famous oceanographer. It's not really an SI unit, but it's closely related to one. It's simply one million cubic meters per second. So it's a volumetric discharge rate, just like we've been using in rivers. It's a million cubic meters per second.
And one way to remember this, that if you add up all the discharge of rivers in the world, all the freshwater rivers dumping water into the ocean, the number is approximately one Sverdrup. It just turns out, by accident, to be that way. Summing up the Amazon, the Mississippi, all the major rivers, you get a number something like this. It's a good comparison point for then looking at the discharge in the ocean currents.
The Florida Current, which is where the Gulf Stream is passing up along the coast of Florida, it's only 30 Sverdrups there. But a few hundred miles north of there, where it's just leaving Cape Hatteras and heading eastward, If you do a north-south section through it, it's grown to 150 Sverdrups. One of the strongest currents in the world.
The Labrador Current, that cold current coming down through the Gulf of Maine and reaching, in some cases, even Massachusetts, has about eight Sverdrups. That Antarctic Circumpolar Current that I mentioned, at least where it passes through the Drake Passage, is 110 Sverdrups.
And the Kuroshio Current is 50 Sverdrups. Somewhere between these two estimates for the Gulf Stream. So these are just round numbers, but they'll give you some sense for how much water is moving around in these ocean currents.
Atlantic Ocean Circulation [00:18:49]
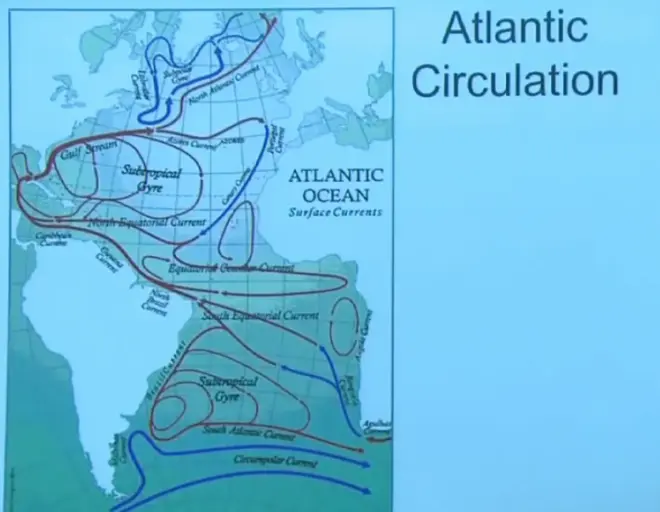
So let's focus on the Atlantic Ocean for a few minutes. It's complicated. The Antarctic Circumpolar Current flows along at the southern edge of it. Some cold water gets peeled off and put northwards into the Benguela Current. And we've talked about the role that this place plays in keeping the south equatorial Atlantic rather cool.
Very few hurricanes form in here. And the ITCZ never really shifts south of the equator in this ocean. And that's because of the cold water being brought up by the Benguela Current. There is a South Pacific—sorry a South Atlantic Gyre. And it consists of the South Equatorial Current, the Brazil Current, the South Atlantic Current, and then the return in the Benguela Current.
And that is, you've got another gyre, a subtropical gyre, consisting of the Gulf Stream. Some would call this the Gulf Stream extension, or the North Atlantic Current. It returns in the Canary Current and then the North Equatorial Current there. Some of this enters into the Caribbean Sea. Then between Mexico and Cuba, it flows up into the Gulf of Mexico. Then comes out right along the coast of Florida. And that's the number I quoted you for the Florida Current. But then additional water joins it, and by the time it gets out here, it has more total transport than it had as it moved up along the coast of Florida.
Then you've got the Labrador Current up here. Water coming down out of the Arctic Ocean moves along the east coast of Greenland, back up along the west coast and Baffin Bay, and then becomes the Labrador Current, then comes down here. And that's a cold current.
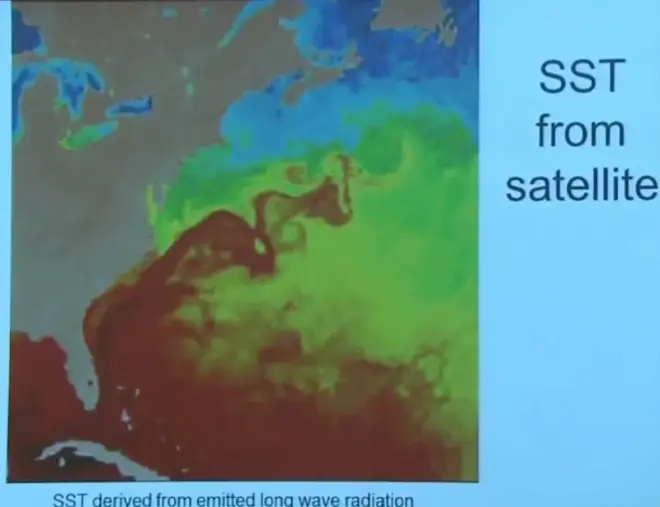
Here's a satellite image. One really neat way to look at this is just to take an infrared, a thermal infrared image of the ocean. Play some tricks to get rid of the clouds, and then interpret the intensity of that radiation as the temperature of the emitting object. Remember the Stefan-Boltzmann law--the warmer an object is, the more it radiates.
So that's what's done here. A color code has been applied. The red is areas that are emitting strongly in the thermal infrared. The blue are areas that are emitting less strongly. And then that's directly related to the temperature of the sea surface. So this is sea surface temperature.
Warm water in the tropics. And then this little stream of very warm water coming up here. It's getting mixed in a little bit, but it continues as a warm water current, until it leaves Cape Hatteras. We see it continuing, but as soon as it leaves, it begins to meander. And you form eddies on both sides. Cold eddies poking through from west to east. Warm eddies from east to west. And it begins to mix in.?However, you can still see remnants of it further across the ocean. And it still has a pretty good speed there, but it's losing some of its thermal characteristic as it mixes in with the environment.?
So if you were to take another image a week or so later--if you took it just a day or so later, it would look a lot like this. But if you took—if you waited a week and took another image of it, those eddies would have moved around quite a bit, and new ones would have formed. And it would look quite different.
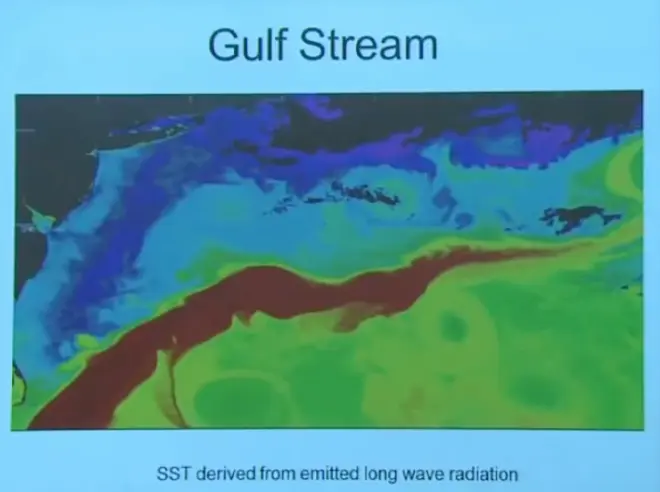
Here's a zoom in on another date. Again, the trick is the same. We're looking at sea surface temperature derived from emitted long wave radiation. And here's Delaware Bay, Long Island Sound, and there's just a little bit of the tip of Cape Hatteras. So you see the warm water coming up here. This may be a little bit of the Labrador Current coming down in here. And then you've got the mid-ocean, the Sargasso Sea out here in the middle.
The color of the water changes from the bright indigo of the tropical to the dirty green of the litoral. So you're getting--this water is basically a clear tropical light blue, but the water back here is rather dirty and green. And you see that boundary very, very sharply as you sail across it.
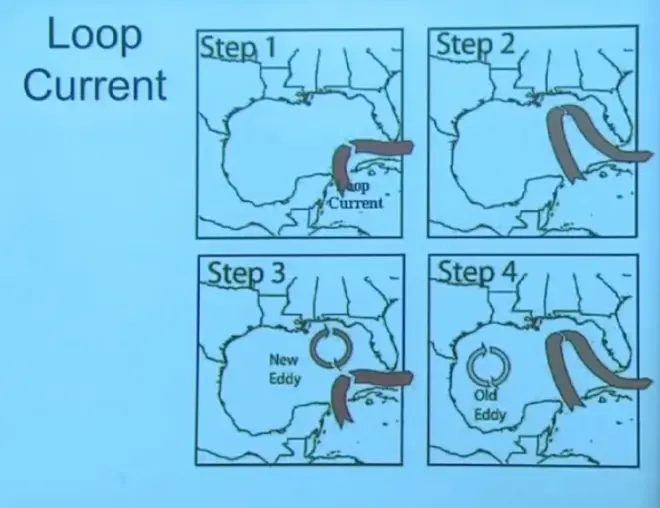
Now, what about this Gulf of Mexico thing, that's rather interesting. It's called the Loop Current. As part of the North Atlantic Gyre, you've got water pushing into the Caribbean Sea, then coming up into the Gulf of Mexico in a well-defined current. But that current is not steady. It changes from week to week, and it goes through a cycle.?
For a few weeks, it'll seem to turn directly eastward and end up in the Florida Current. Then that loop seems to elongate. Then that will break off, it will form a clockwise eddy, which will then drift off. And the shortcut is then reestablished.?That eddy will eventually drift into the western part of the Gulf of Mexico, and the cycle will then continue. So it's an unsteady current going through this cyclic behavior of taking a shortcut, extending in a long path, and then breaking off into a new eddy.
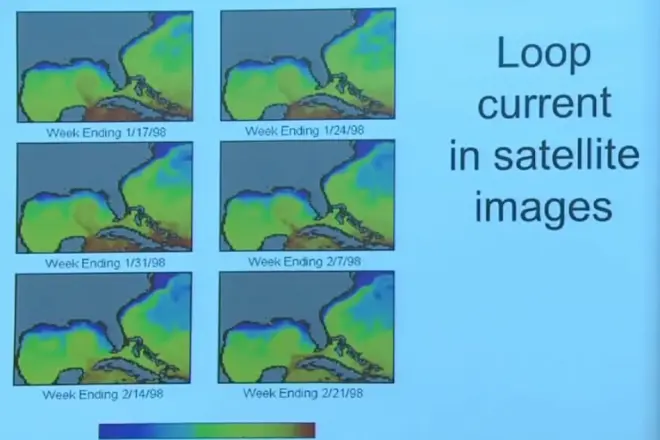
And you can see that in satellite images. And here's a sequence of satellite images. And the dates are given here. They're from 1998. But there's the loop. And then as it drifts westward, it weakens. The new direct link is established there to get water into the Florida current. So depending when you're down there, you're going to find either a lot of warm water here or not, depending where you are in the phase of this cyclic alteration.
Primary Productivity in the Ocean [00:31:45]
We're interested in the relationship between physical oceanography, that we've been talking about so far, and biological oceanography. In particular, what is it that controls productivity in the world ocean? By this I mean biological productivity.
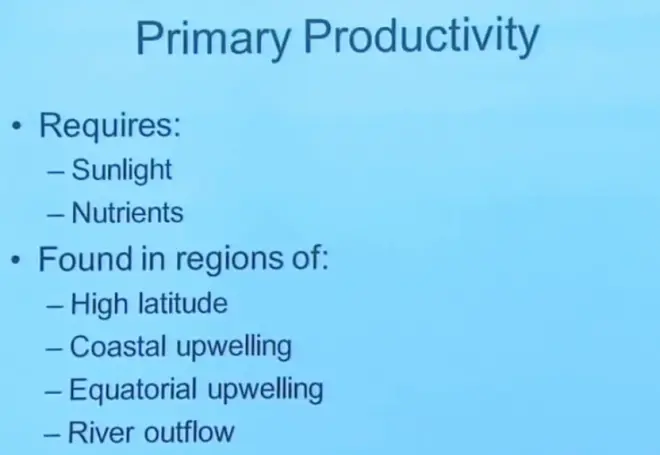
The most basic level, where the food chain begins, is called primary productivity. And it's usually referring to plant life in the ocean.?Plant life requires sunlight and nutrients. You need to get those two things together in order to get the primary productivity. And then the rest of the food chain builds on that. And there are vast parts of the ocean that are devoid of any primary productivity. And for that reason, largely devoid of any biological activity at all.
But there are other regions in which biological activity is very, very active. And if I had to categorize them,?I would put them into those four categories. There's a lot of primary productivity in high latitudes, in regions of coastal upwelling, in regions of equatorial upwelling, and in regions of river outflow. And for the most part, the rest of the ocean is very limited, if not completely devoid of primary productivity.
Here's the typical food chain. You start with single-celled life that are plants. And they require sunlight and nutrients, especially phosphorus and nitrogen. It's a carbon-based life, which there's plenty of carbon available. So it usually depends on the phosphorus and the nitrogen that allows that to get started.
These organisms get eaten by small animals, so-called zooplankton. These are so-called phytoplankton. They get eaten by zooplankton. And then, in turn, eaten by small fish, larger fish, larger fish, and so on. So that's the base of the food chain. That's the primary productivity there.
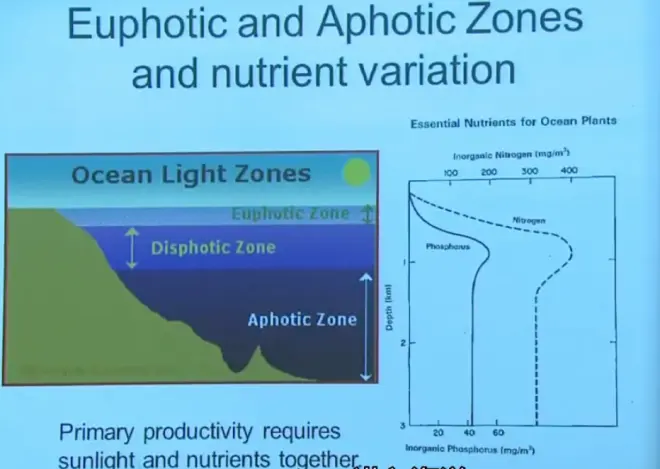
Now, here's the great catch 22 for ocean productivity. You need light from the sun. But light is absorbed rather quickly as you go down into the ocean. The region that has lots of light in the ocean, the upper 50 or 100 meters is referred to as the euphotic zone. There's a layer beneath that that gets a little bit of light. And then, however, most, the vast majority of the ocean depth is dark. Because the sunlight doesn't penetrate that far. That's the aphotic zone. Aphotic meaning no light.
On the other hand, if you look at the concentration of nutrients in the ocean--and here, it's plotted versus depth in kilometers. Sea surface, one kilometer, two kilometers. Most of the nutrients, phosphorus and nitrogen, are in the lower parts of the ocean.?And in the upper parts of the ocean, where you have the light, you have depleted nutrients. So here's that catch 22. Where you've got light, you don't have the nutrients. Where you've got nutrients, you don't have the light. That's the great brake upon ocean productivity.
To get ocean productivity, you've got to violate this general anti-correlation, and get the two together. You can't get the sunlight deeper, so the only way to do that is to get some of these nutrients up to the surface. And that'll be the focus of our discussion for primary productivity. ?It's because you've had some blooms of phytoplankton. They've depleted the nutrients. And then their bodies will fall gravitationally into the lower ocean, and then rot. And the nutrients are released again, but because of gravity, they're released in the lower parts of the ocean. And once that has happened, then you have that depletion. And the, at least in this simple set of plots, the productivity would shut down. You need to do something to reestablish concentrations of nutrients in the surface waters of the ocean in order to get the primary productivity reestablished.
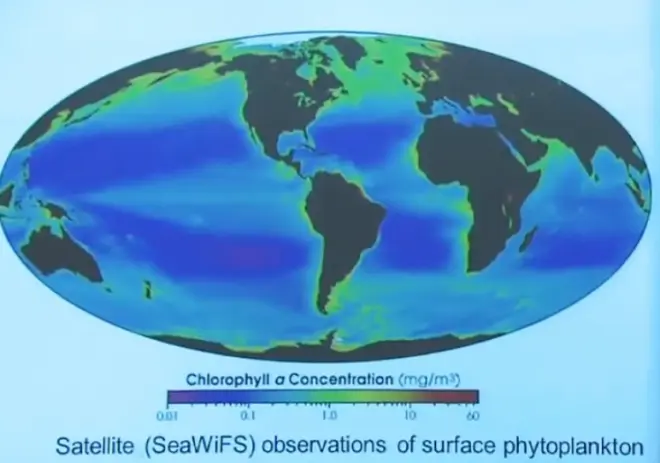
This is one of my favorite diagrams. It comes from a satellite in orbit called SeaWiFS, which looks down at the surface of the ocean. And by using two channels, two reflected channels, it maps out the concentration of chlorophyll--chlorophyll a in this case--in the surface waters of the ocean. So in a way, it's detecting those phytoplankton directly, because they have chlorophyll in their bodies.
And so, here we have a global map of the primary productivity in the ocean. It's a remarkable thing. And the scale here, it's a log scale, the units are milligrams of chlorophyll per cubic meter of ocean water. Going from 60 units on down to 0.01 on a log scale. So the purple areas are biological deserts. There’s really very little primary productivity going on in these areas.
We can imagine why that is, because remember, that warm water lens extends from there to there. And so, you've got this layer of warm water floating on the sea, very strong thermocline beneath it, which, just like an inversion in the atmosphere, makes it very difficult to mix water vertically. So while you probably have a lot of nutrients just a few hundred meters down, because of that static stability in the thermocline, you can't mix it to the surface.
So let's talk about the high latitudes.?High latitudes are generally high productivity. That's because that warm water lens doesn't extend to high latitudes. You've got cold water at the surface. You've got cold water at depth. You don't have a strong thermocline in the high latitudes. You do have?strong storms in the atmosphere, putting winds on the surface of the ocean, tending to mix things.
So it's pretty easy to get water to mix up and down when you're in the high latitudes. And that's why a lot of the major world fisheries are found in high latitudes, because you can get primary productivity, because you can mix up the nutrient-rich waters into the euphotic zone and get those phytoplankton growing.
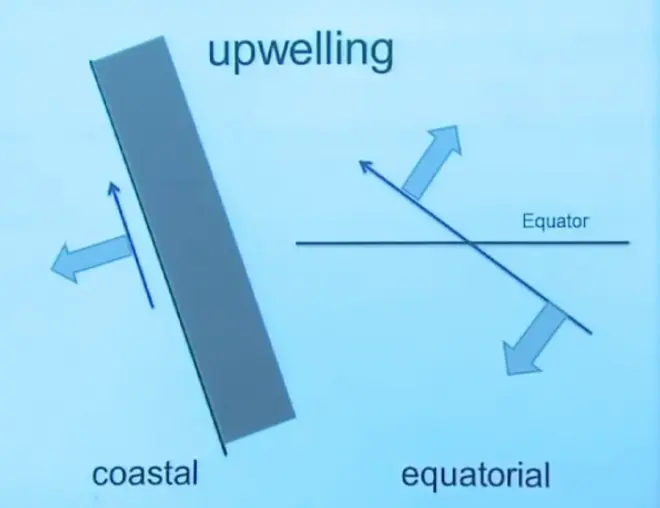
A second example would be?coastal upwelling. There's a lot of upwelling, a lot of productivity, for example, along the Peru coast. And that, we believe, is due to coastal upwelling. Basically, you have winds putting a wind stress on the ocean. And the Ekman drift that responds from that is pushing water offshore. So if you're pushing surface waters away from the shore, then that must be replaced by waters coming up from the deep.
So any time you're--for example, if the wind was like this, the Ekman drift would be perpendicular to that, pushing water offshore and allowing nutrient-rich deep waters to come up to the surface, giving you high productivity along that coastline. And you find at other places as well. Coastlines tend to be highly productive because of the upwelling and the mixing that can occur there.
Equatorial upwelling. I think this is the most remarkable aspect of this diagram, is this little line. And some other productive areas around it, but especially that little line right at the geographical equator. That's not at the ITCZ. That's not approximately at the equator. That is at zero degrees latitude. There's a highly productive region right at zero degrees latitude. It's where the Coriolis force switches sign, from being to the right, to the left. That's what's unique about the equator.?So, for coastal upwelling, if that's the continent and the wind is like this, it pushes the Ekman drift offshore, it must be replaced by upwelling.?
Let's say the ITCZ is located somewhere north of the equator. So the winds crossing the equator are the southeast trade winds. The southeast trade winds. So the wind stress is along the blue arrow. When you're in the Southern Hemisphere, the Ekman drift is to the left of the wind stress. When you're in the Northern Hemisphere, the Ekman drift is to the right of the wind stress.?That is pulling water northwards away from the equator. This is pulling water southwards away from the equator. That water must then be replaced by upwelling.?
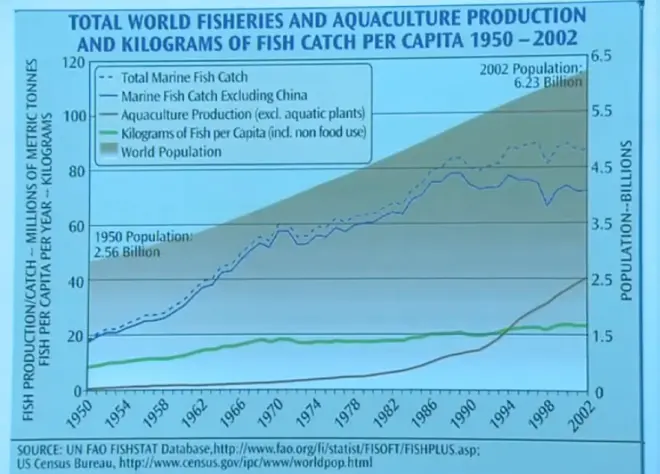
Now, it's a little sad to notice that we pretty much exploited the world's ocean productivity. In the blue is the total marine fish catch from 1950, in units of millions of metric tons. And it's been increasing from the 1950s. But then, about 1990 onwards, it's pretty much plateaued. In other words, we're taking about as much edible biomass out of the oceans as the oceans can produce. So the human population has grown to the state that it's pretty much fully utilizing everything that the ocean is producing in these high productivity zones.
I won't go through this in detail, but the point is, that it was known by the whalers also that you had highly productive regions in the high latitudes. But also, an additional high productive region right along the equator. They didn't know it was because of a shift in the Ekman layer, but we know that now, that you have a zone there of high productivity.?