
【質(zhì)譜】MZmine助力非靶向代謝組學(xué)的流程

Non-target screening LC-HRMS workflow
MZmine
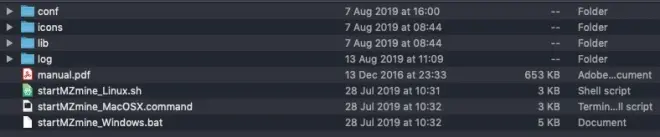
Open MZmine by double clicking the file “startMZmine_Windows.bat”, located in the folder “MZmine-2.41.2” on the desktop of your computer.
Import Data Files
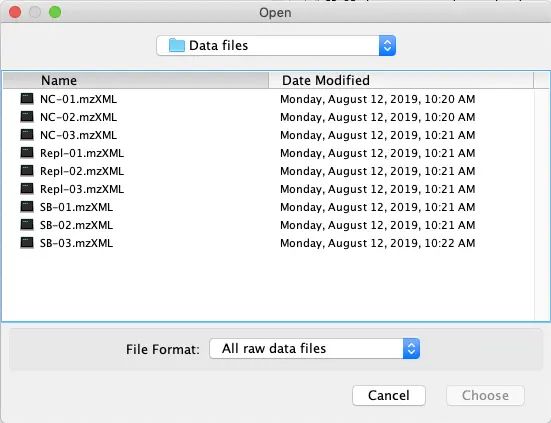
Go to?Raw data methods – Raw data import?and select all files (9) in the “Data files” folder. Click the ‘Choose’ button to start the import.
After the import is complete, select all 9 files in the window in MZmine, then right-click and select ‘Remove file extension’.
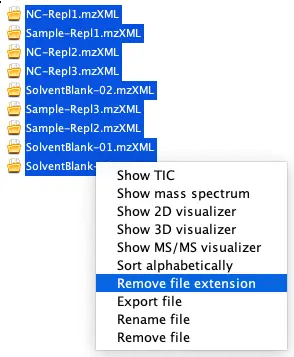
Tip: Sort alphabetically as well!
Check quality of data
A. Retention Time shifts
Check for possible RT shifts by selecting some datafiles, right-click and select “Show TIC”.
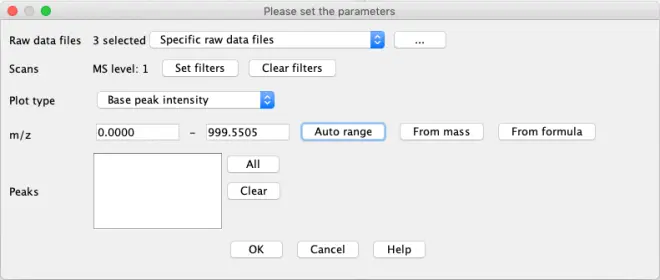
“Set filter”: Different parameters such as retention time
“Plot type”: Set how the Y-value should be calculated. Set to ‘TIC’
Tip: Hover over to see explanation of option
“m/z”:
Auto range goes from min to max m/z value in data
From mass: extract specific m/z value by number value
From formula: extract specific m/z value using the molecular formula. Useful to check a specific compound with known presence
First choose ‘Auto Range’ for the m/z values. Click ‘OK’
Second, use the formula for chlorogenic acid (C16H18O9) knowing we work in negative ionisation where molecules get deprotonated ([M-H]-). Set the m/z tolerance to
0.005 or 15 ppm. Click ‘OK’
Notice the difference between the two, try out the different options in the chromatogram window.
Tip: In the parameter window, click ‘Help’ if you need more details for all possibilities
This will show the total ion chromatogram, the raw total data signal from the mass spectrometer. Some basic visual inspection can be performed here.
Peak Detection
Peak detection in MZmine consist of 3 important steps:
Mass Detection
Chromatogram builder
Deconvolution
Mass Detection
Raw data methods – Feature detection – Mass Detection
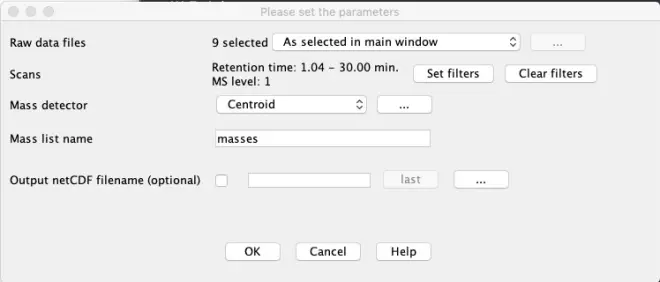
“Raw data files”: Set to ‘All data files’
“Mass detector”: Set to ‘Centroid’ as our data is already centroided.
Scans – Set Filters
Press the ‘Set filters’ button to set specific options to reduce the number of MS-scans to be checked.
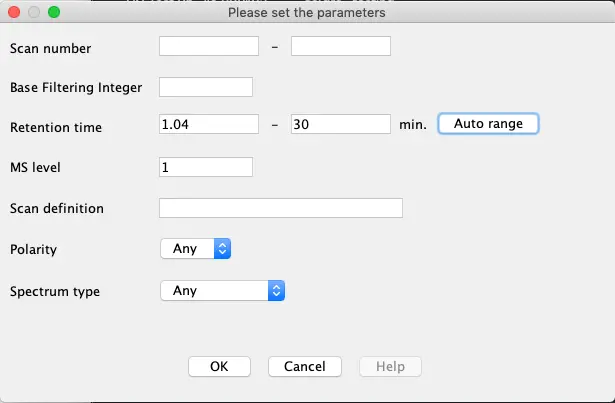
Retention Time: Set the range from 1.04 to 30 minutes
MS level: 1
Only MS scans between 1 and 30 minutes will be used. Before and after this time LC effluent was not sent to MS.
Mass detector
From the?drop-down list?we select the ‘Centroid’ option for the mass detector as our data is already centroided. Other algorithms work only with continuous type data.
Click on the ‘…’ button to set the noise level. This is the minimum intensity level for a data point to be considered part of a chromatogram. All data points below this intensity level are ignored.
Noise: 500
By selecting the ‘Show Preview’ option, you can see the results of the value you entered in the actual data. Mass peaks in red satisfy the set criteria and will be used. Mass peaks in blue are below the set threshold and will not be picked.
After clicking on OK, a mass list will be built with all masses from the selected data files.
Chromatogram builder
Next step is to create chromatograms from the selected masses during the mass detection. Go to?Raw data methods – Feature detection – ADAP Chromatogram builder.
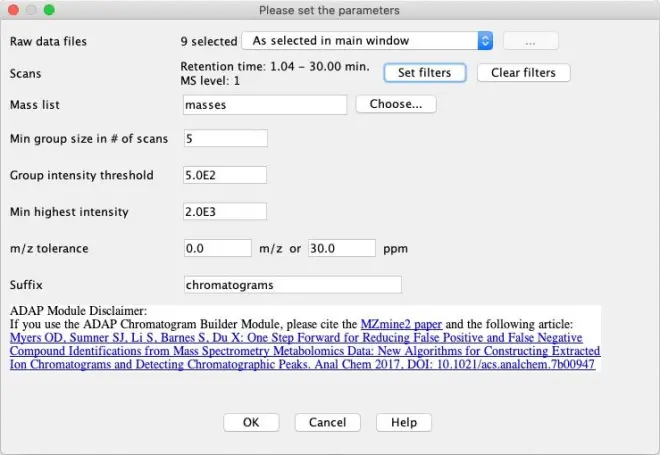
“Raw data files”: Set to ‘All raw data files’
“Mass list”: press the ‘Choose’ button and select the earlier created ‘masses’
“Min group size in # of scans”: The entire EIC must have at least this number of sequential scans with points above the Group intensity threshold set by the user. Leave at the default number of 5.
“Group intensity threshold”: Set equal to the noise level used previously; 500
“Min highest intensity”: There must be at least one point in the EIC that has an intensity greater than or equal to this value. Set to 1000 (2x noise level).
“m/z tolerance”: 0.0 m/z or 20 ppm
Press ‘OK’. The chromatograms will be built and will be displayed on the right-hand side of the main window.
Tip: After building the chromatograms, sort the peak lists by selecting them, right click and sort alphabetically to keep things ordered.
Right-click on one of the sample feature lists you have created (e.g. “Sample-Repl2 chromatograms”) and select show Feature list table. All detected features are visible here. As you see, a lot of ‘junk’ is still present and must be filtered out as much as possible to avoid false positives, without losing true positives.
Deconvolution
Go to?Feature list methods – Feature detection – Chromatogram deconvolution.
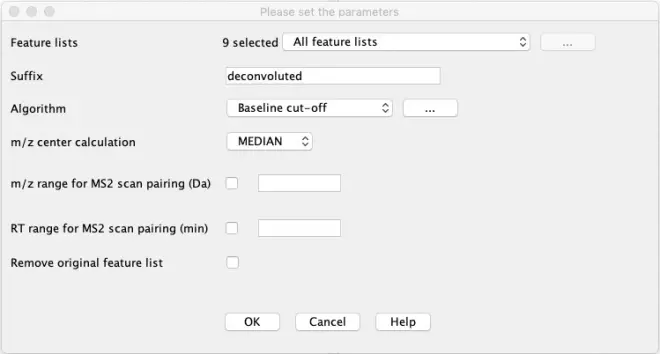
“Feature lists”: Select all feature lists
“Algorithm”: Select ‘Baseline cut-off’. The algorithm removes the lowest part of the chromatogram below a Baseline level specified by the user. Remaining peaks that stand out above the baseline level are recognized if they fulfil the height and duration requirements.
Click the ‘…’ to set specific parameters for the algorithm
Min peak height: 2000
Peak duration range: 0.05-2.00 min
Baseline level: 500
Click on show preview, navigate to feature list ‘Sample-Repl2 chromatograms’ and select the chromatogram of chlorogenic acid (353.0888 m/z). If the peak is picked it is colored in red. Try changing the parameters to see the impact of your changes on the result.
“m/z center calculation”: Median
“Remove original feature list”: Leave unchecked
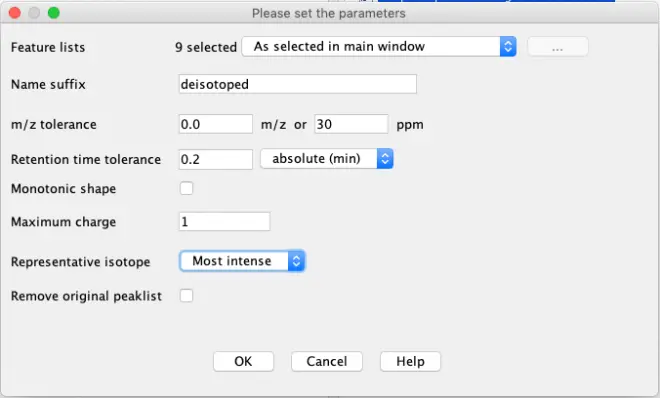
Deisotope
As we haven’t corrected the mass list yet for isotopes, select the deconvoluted feature lists and go to?Feature list methods – Isotopes – Isotopic peaks grouper.
Alignment
Next, we want to align the feature lists of all the different samples, negative controls and blanks.
For purposes later on during the data analysis, it is important that the order of the files is correct. Therefore, select all the deconvoluted & deisotoped peak lists (9), right-click and select “Sort Alphabetically”.
Once the peak lists are sorted alphabetically, go to?Feature list methods – Alignment – RANSAC aligner.
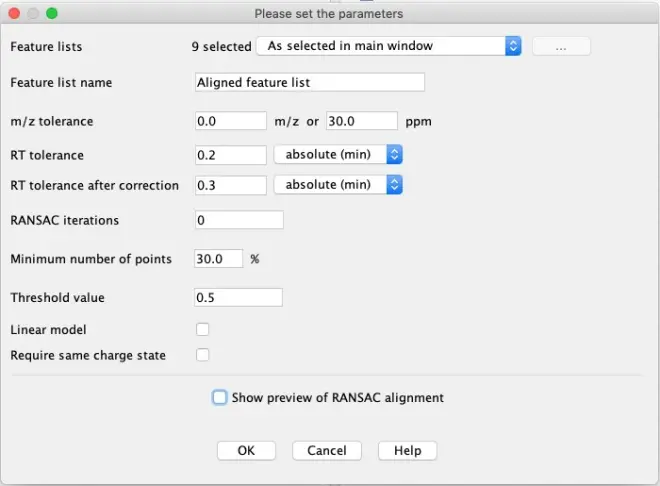
Enter the criteria as shown in the above printscreen to align the features in all samples. Using these criteria, MZmine will try to build a model to perform the alignment.
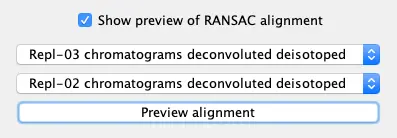
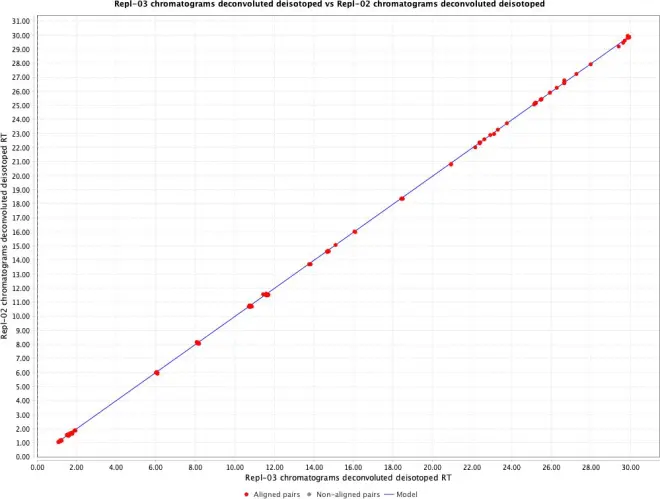
When you click “Show preview of RANSAC alignment, you can have a visual idea of the model which is created to align the samples. Select 2 data files (e.g. Repl-02 and Repl-03) and click on the button “Preview alignment”.
To start the alignment, click the OK button.
Re-iterative gap filling
Take a look at the peak list table of the aligned feature list by right clicking on the list and selecting ‘Show feature list table’. There are still gaps because of missing peaks in the peak picking/…, which are shown as red dots.
You can let the software look up these missing peaks and see if you can still find them. Select the peak list and go to?Feature list methods – Gap filling – Same RT & m/z range gap filler.
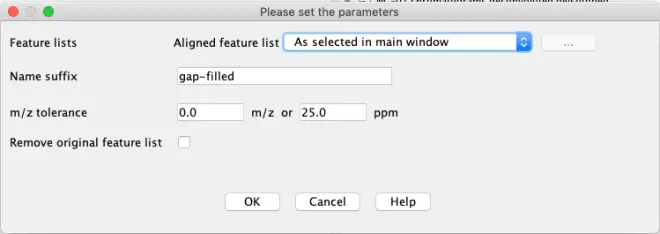
If you now go to the gap filled peak list, you will see some red points have been found, shown with a yellow dot.
Removal of duplicates
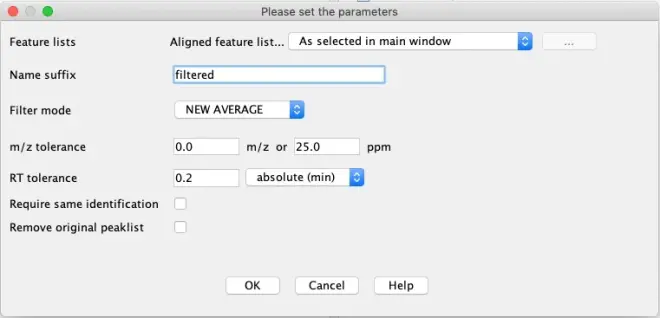
When peaks weren’t properly aligned, they ended up as duplicates in the gap-filled peak list. To reduce these, select the peak list and go to?Feature list methods – Filtering – Duplicate peak filter.
Export data to CSV
Select the filtered peak list and go to ‘Feature List Methods – Export/Import – Export to CSV file’.
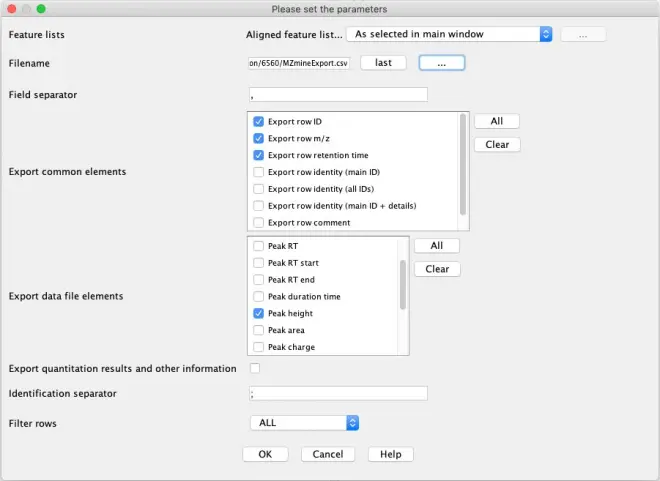
In the ‘Export common elements’, select:
Export row ID,
Export row m/z
Export row retention time.
In the ‘Export data file elements’, select Peak height.
Save the data in the “R script” folder. Name the fie “MZmineExport.csv”. To locate the folder where to store the export file, click on the “…” button in the File Name line.
invitro (R-script)
In the folder located on your desktop, go to the “R” folder and double click the file “NutRedOx-WS.Rproj” file to start R-studio.
Once Rstudio is open, open the file “NutRedOx-tutorial.Rmd” by clicking on the file, which you can find on the lower half on right-hand side of the screen in the tab ‘Files’.
This is an interactive document which will guide you through the data prioritization in R.
It contains detailed explanations on the different steps, as well as the code of the algorithm to execute.
A block of code can be recognized by the three accents at the beginning and end, e.g.:
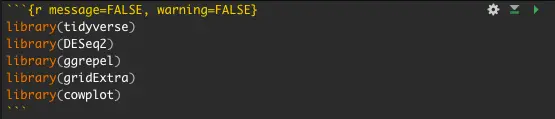
To execute this block of code, you need to press the green play button in the top right corner of the text block.
Follow the complete prioritization in R before you proceed to the Identification.
The end-result will be an Excel file with the significant features which is stored in the R- folder. Open this Excel file.
Only the features in this list have passed all the criteria of the prioritization and are interesting enough to try to identify. Now, go back to MZmine and try to identify the remaining features.
Identification
Generate formula
The prioritization of the features in R lead to a final list of significant features. This means: features that are possible colonic biotransformation products of chlorogenic acid. For each feature, this Excel file contains information such as mean intensity in each sample, the?m/z?value, fold change (FC), p-value etc.
As you may remember: The?m/z?value stands for mass over charge. So the?m/z?value is linked with the mass of the feature and the mass can be linked to a possible formula of the feature.
We will now try to generate a formula for each of the remaining features from the R- analysis.
In MZmine, select the final peak list (aligned & gap-filled, duplicates filtered) from before, right-click and open the feature list table.
Right-click on a feature in the list and go to Search – Predict molecular formula:
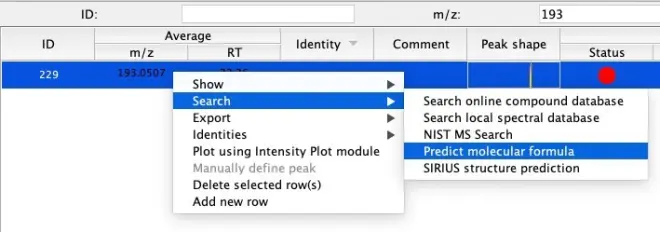
Tip: Within the list of features, filter using the search boxes on top of the window to find your feature of interest quicker.
Select the following criteria:
Ionization type: [M-H]-
m/z tolerance: 0.001 m/z or 5.0 ppm
Elements:
o C: 0 – 100
o H: 0 – 100
o O: 0 – 10
Click on OK to generate a formula for the selected feature, using the entered criteria. A popup window will be shown to display possible formulas.
If a formula is proposed, select the formula from the list and confirm with the “Add Identity” button.
Remark: If no formula is proposed by MZmine, this means no formula could be linked to the m/z value. In this case, the feature is a remaining false positive hit and should be ignored. This occurs quiet often when working with real datasets.
MS/MS confirmation
When step 3.1 is completed, our list with interesting features is narrowed down to the features with a predicted formula. How can we link these formulas to the structure of a possible colonic biotransformation product? As mentioned during the lecture of Philippe Vervliet, here are some different options:
Comparison with the output of?in silico?biotransformation prediction tool/software (e.g. Meteor,?http://Biotransformer.ca). These tools will predict possible biotransformation products of (for this example) chlorogenic acid.
Comparison with online databases. Examples: Pubchem, Chemspider, Chemtox, Human Metabolome Database
Comparison with existing literature.
We have simulated the output of an?in silico?biotransformation prediction software. It is located in the folder ‘Identification’, which is a subfolder of the workshop folder on your desktop. This Excel file is a combination of possible biotransformation products and contains information such as name of the biotransformation product, structure, mass,?m/z?value and possible MS/MS fragments of the structure.
Tip: Search for the formula found in step 3.1.
Remark: Note that 1 formula???1 structure. In some cases, multiple structures are possible for a certain formula.
Final step: In order to discriminate between multiple possible structures (Which is the right one?) or to increase the level of identification (How sure are we of the proposed biotransformation product/structure?), we need more data about the structural information of the features: MS/MS spectra.
Tips:
Start with the MS/MS spectrum of the parent compound (Chlorogenic acid), as in some cases the MS/MS-fragments correspond to possible biotransformation products, or mutual MS/MS-fragments are observed for the parent compound and other biotransformation products (Which means: similar structural properties!).
Compare the MS/MS fragments with those in the database.
Try to link the different fragments to the different parts of the molecule.
To show the MS/MS spectra in MZmine, open the feature list table of the final peak list (aligned & gap-filled, duplicates filtered) by right-clicking and then selecting “Show feature list”. Next: Find your feature of interest in the list, right-click on a feature and go to Show – Most intense MS/MS. A new window will be opened, showing the MS/MS spectrum of the selected feature.
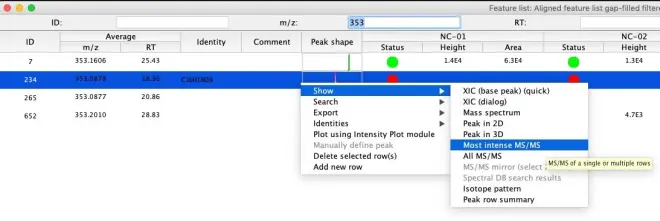
If no MS/MS spectrum was recorded for a specific feature, you will not have any information about the structural properties, leading to a lower confidence level of identification (e.g. Level 4, See Figure below) as you can only propose a possible formula of the biotransformation product.
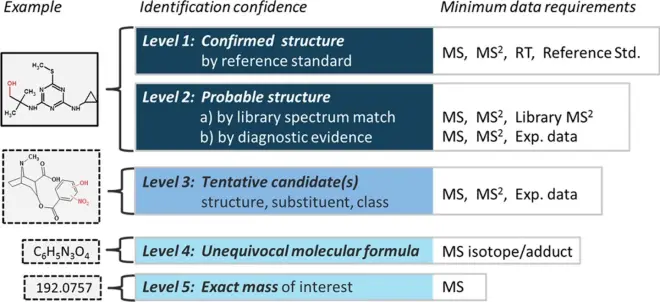
Schymanski et al. Environ. Sci. Technol. 2014, 48, 4, 2097-2098; DOI:?10.1021/es5002105
